When we talk about financial data, the mind immediately jumps to Bloomberg. Perhaps to S&P Global or Refinitiv (Thomson Reuters). But there is a player that most retail investors barely know, one that quietly powers the critical systems of more than 9,000 financial institutions worldwide.
That player is FactSet Research Systems.
The Question Everyone Is Asking in 2026
But here is the question on everyone’s mind in 2026: can a company that sells financial data and analytics terminals survive artificial intelligence? Won’t AI agents simply render FactSet’s entire model obsolete?
I will be blunt and straightforward with you: this is the exact question that motivated this in-depth analysis. Not to scare anyone. Not to be sensationalist. But because my job is to protect your interests as investors. And that starts with asking the right questions, even when they are uncomfortable.
Let’s dive in!
For Newcomers: What Is FactSet, and Why Don’t We Use the Classic P/E?
FactSet is not a serial acquirer in the traditional sense (like Constellation Software doing 100 acquisitions a year).
But it is a compounder: a company that grows its earnings in a regular and predictable manner year after year, with a recurring subscription revenue model and targeted acquisitions that strengthen the overall offering.
Why the P/E Ratio Is Misleading
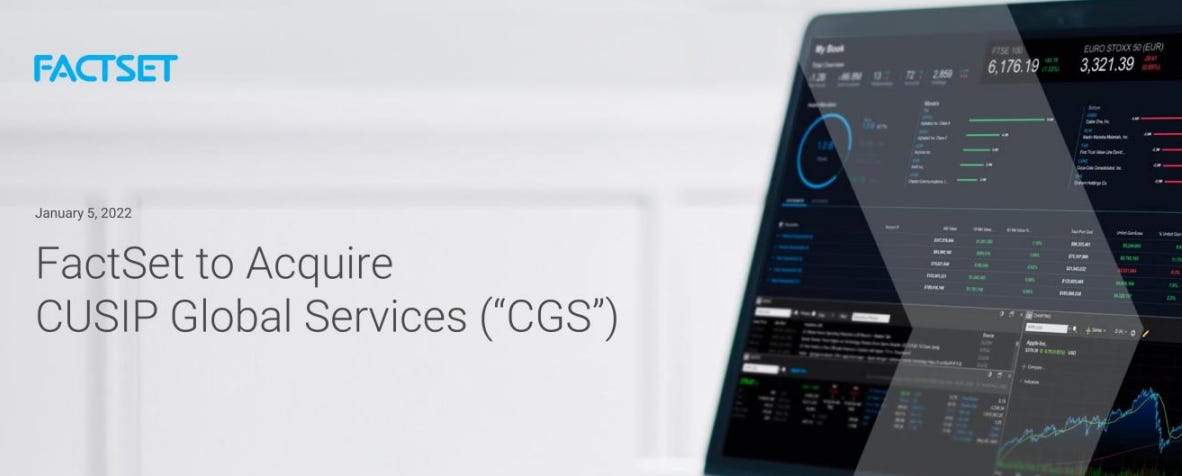
The P/E ratio (Price-to-Earnings Ratio) is misleading for FactSet for one simple reason: the company has made significant acquisitions (notably CUSIP Global Services for $1.9 billion in 2022, then LiquidityBook and Irwin in 2024-2025) that generate massive intangible asset amortization, roughly $75 million per year on intangibles alone.
These charges artificially reduce GAAP net income without affecting the actual cash the company generates.
That is why we focus on Free Cash Flow (FCF): the real money flowing into the company’s coffers after all expenses, including investments. It is the only number that does not lie.
Thank you for reading Bourse 123! This article is public, so feel free to share it.
Thanks for reading Equities 123! This post is public so feel free to share it.
If this analysis brings you value, consider subscribing. It is free and allows me to keep producing this kind of independent, no-nonsense content. Paid subscribers receive analyses early, portfolio updates, and alerts.
Equities 123 is a reader-supported publication. To receive new posts and support my work, consider becoming a free or paid subscriber.
The History, Business Model, and Philosophy of FactSet
A Company Born in a Garage… on Wall Street
FactSet was founded in 1978 by Howard Wille and Charles Snyder. At the time, the idea was simple yet revolutionary: aggregate financial data from multiple sources onto a single computer terminal, so that finance professionals could stop juggling stacks of paper reports.
47 years later, the DNA has not changed. FactSet remains an aggregator and enricher of financial data, delivering it through an integrated platform (the Workstation), data feeds, APIs, and more recently, MCP servers (Model Context Protocol) for AI agents.
The Business Model: The Beauty of Recurring Subscriptions
FactSet’s model is an investor’s dream on paper:
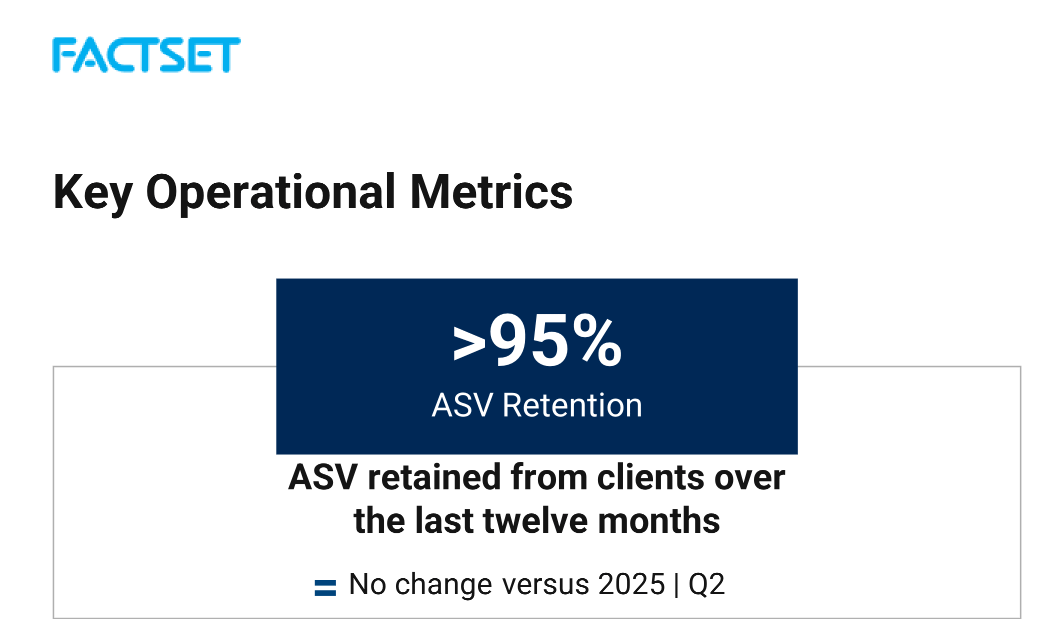
Over 95% of revenues are recurring through subscriptions.
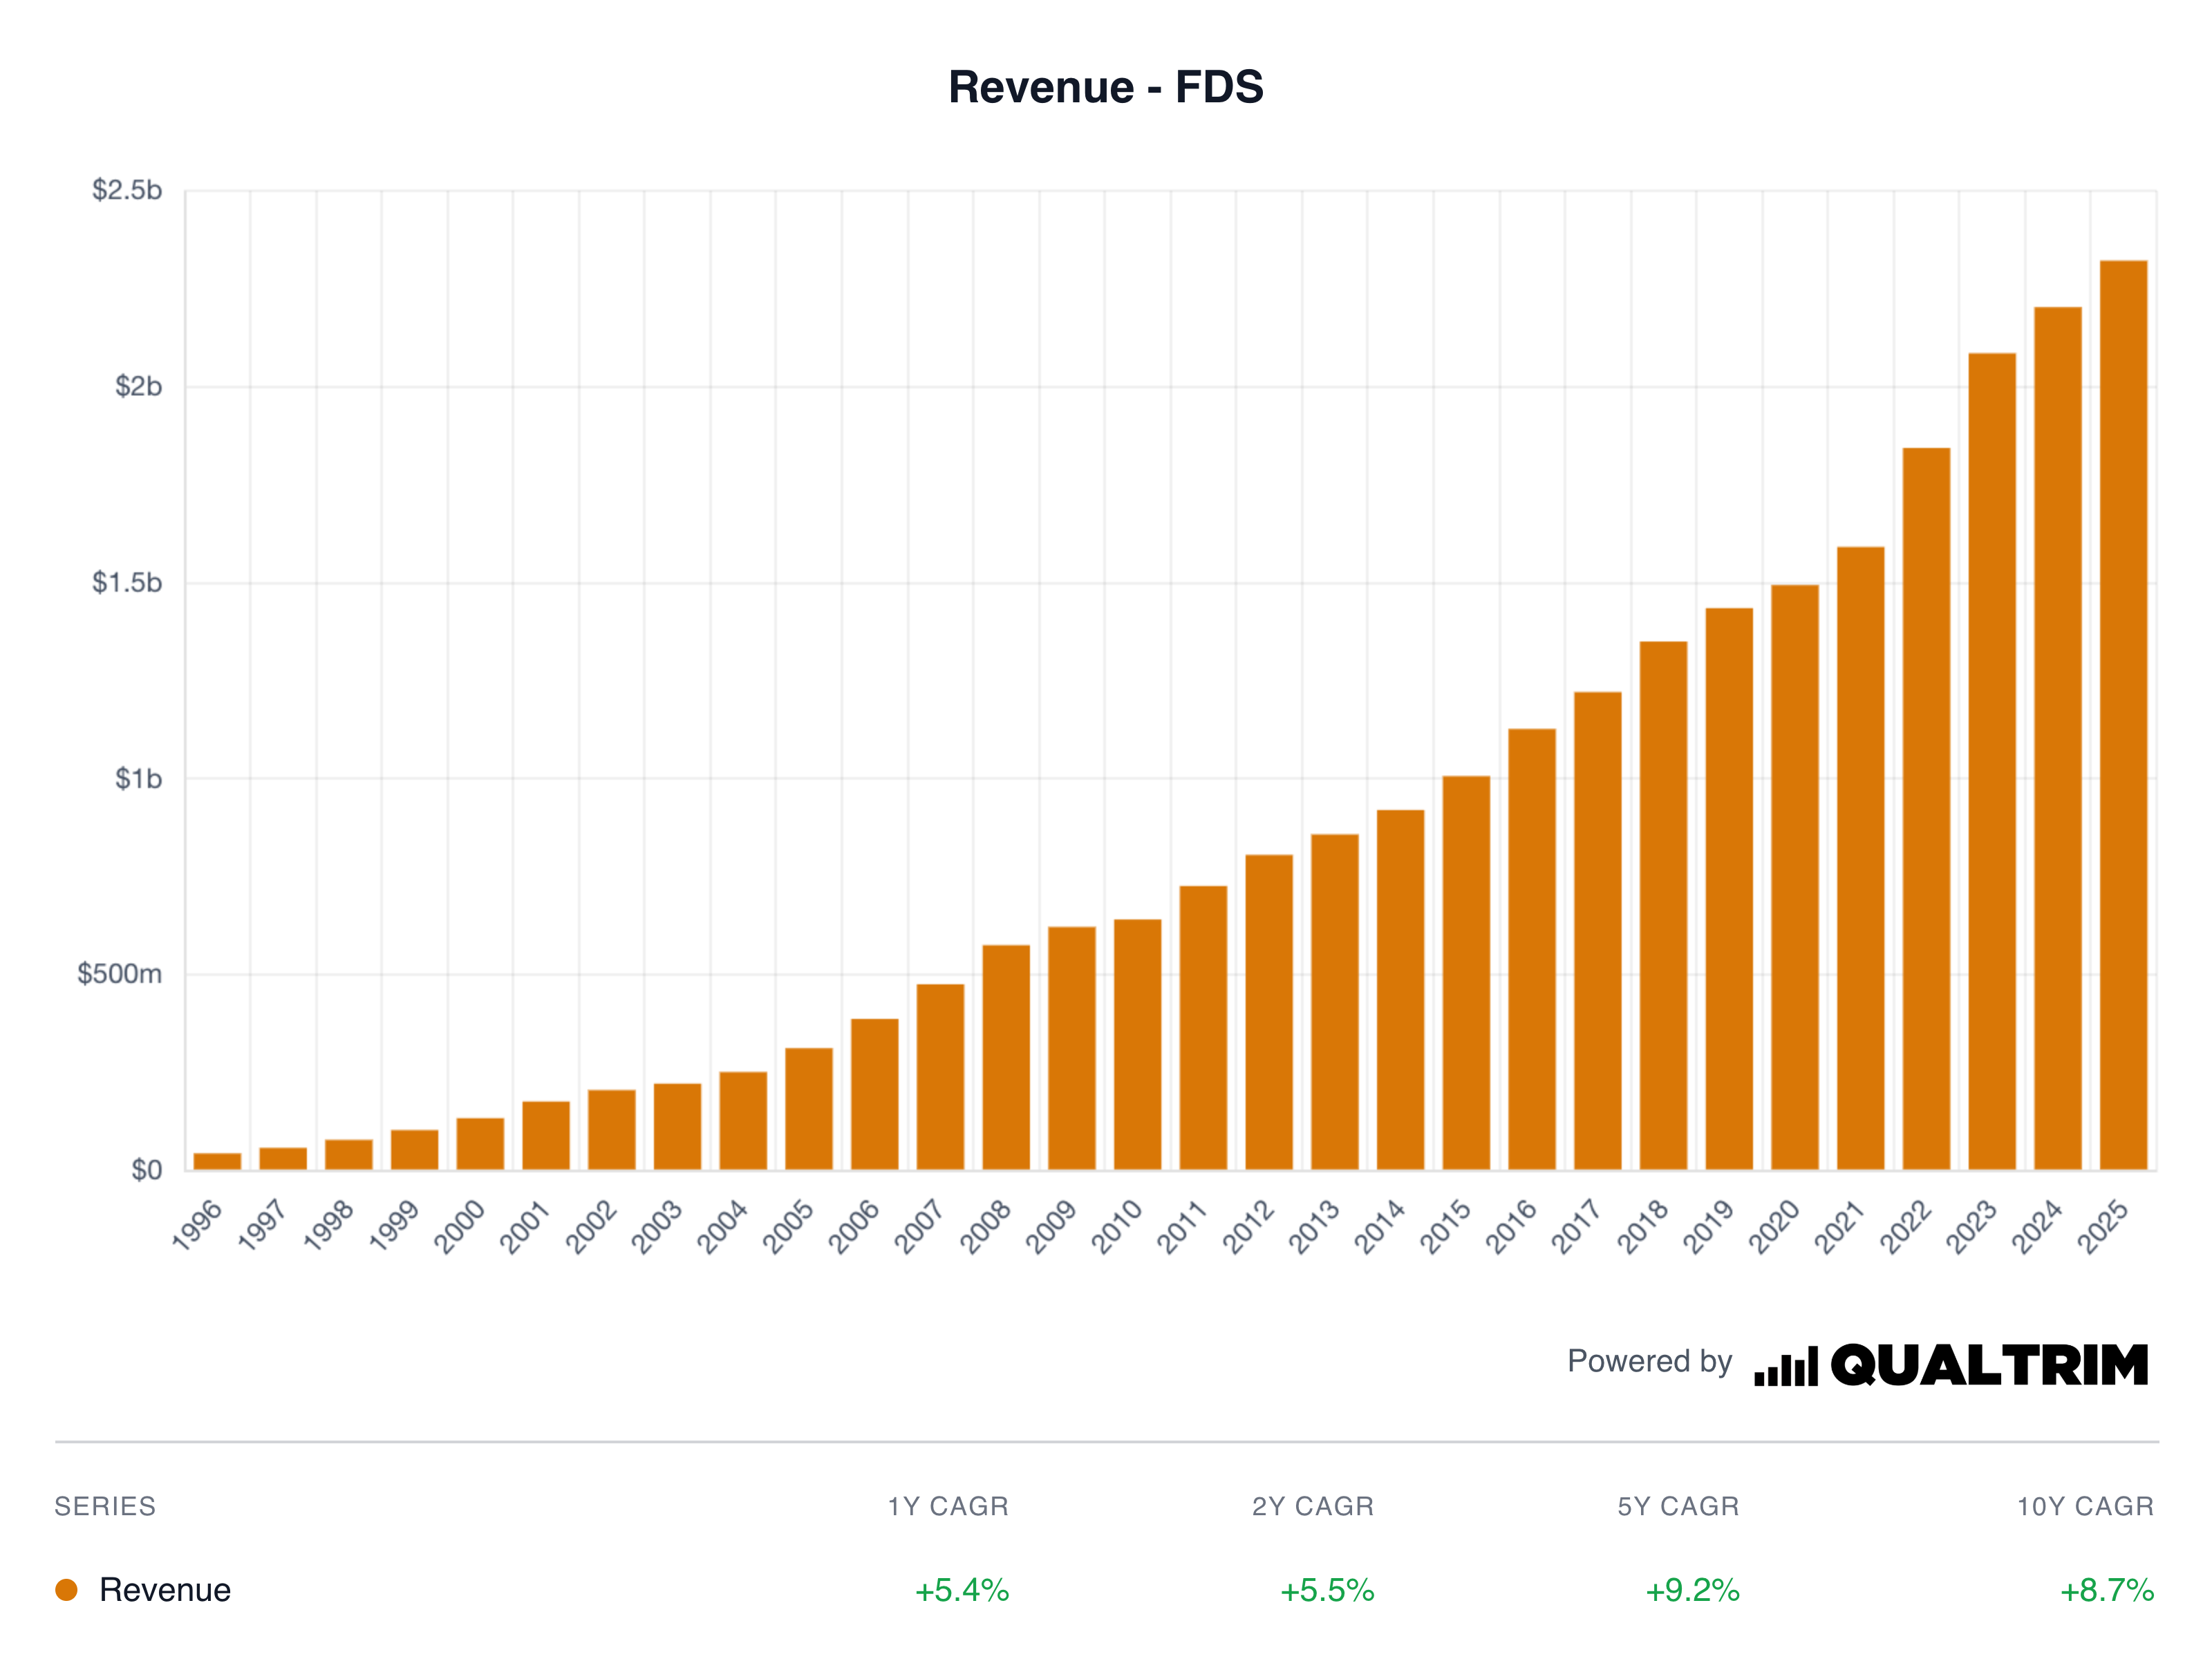
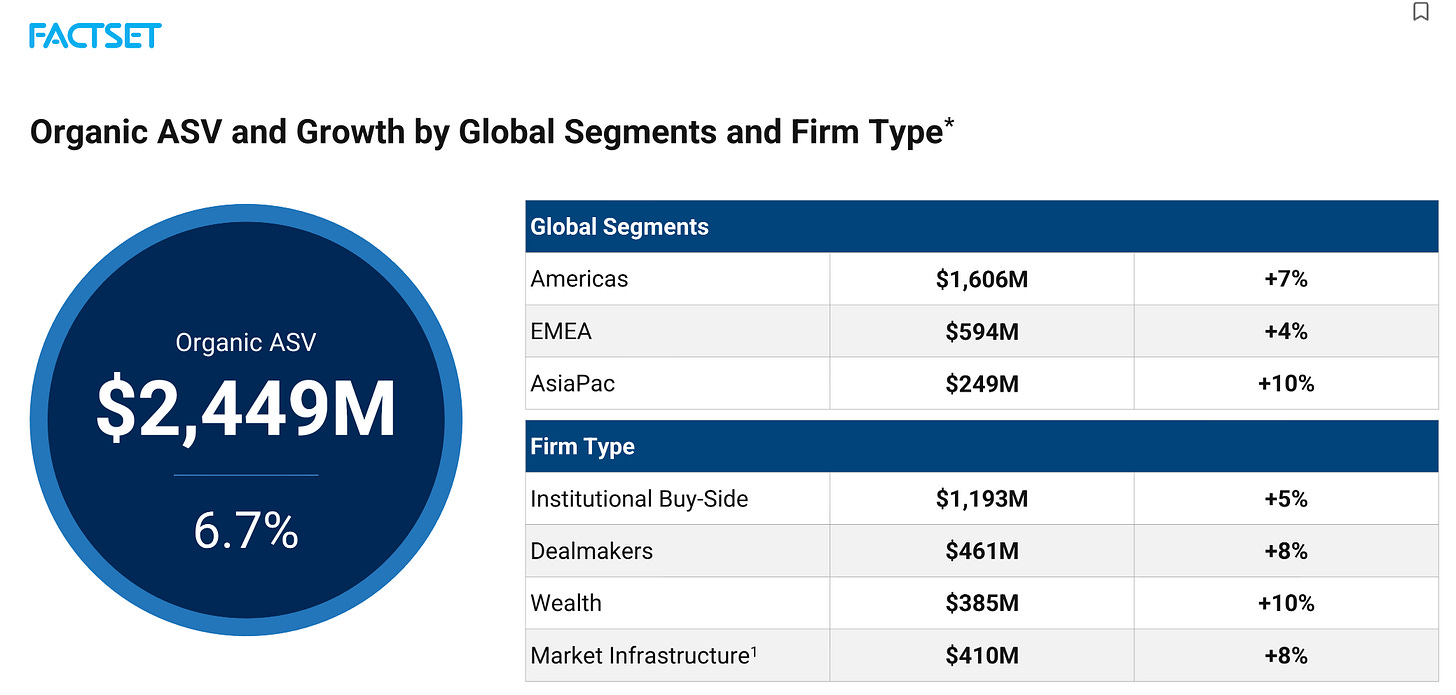
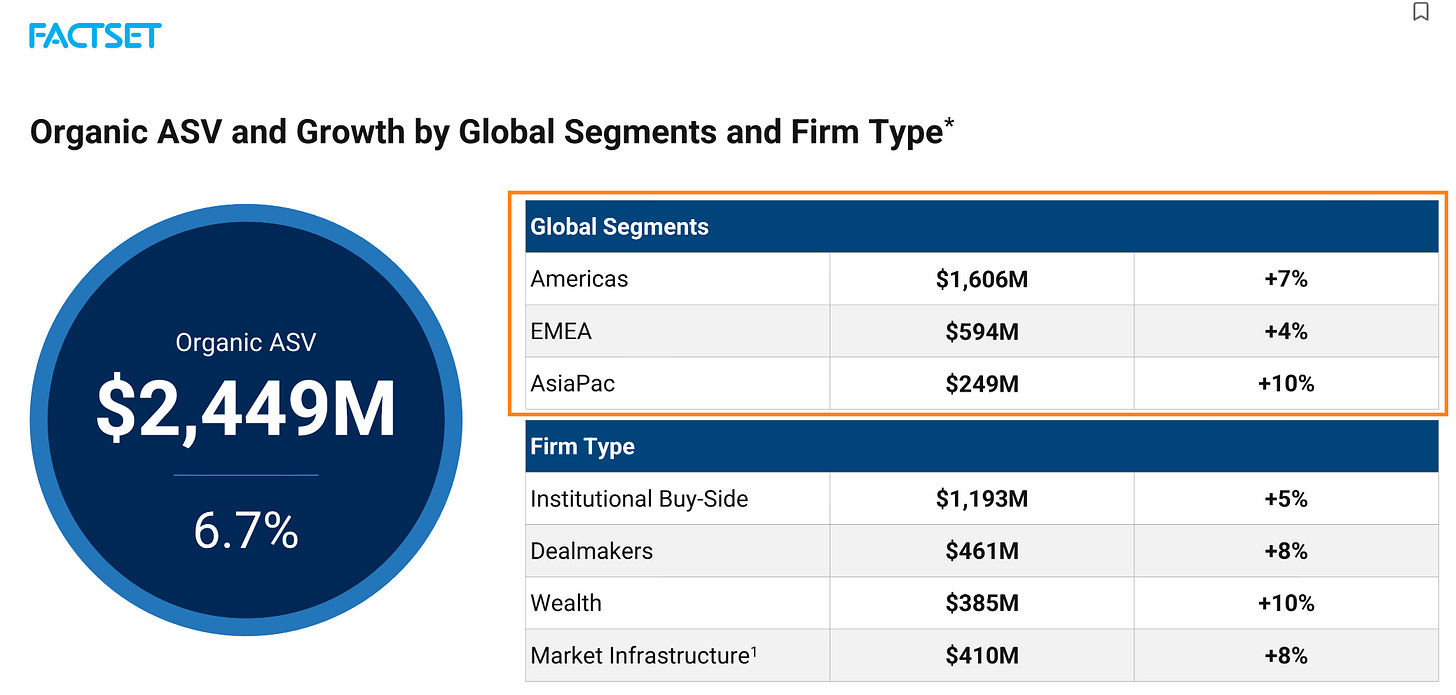
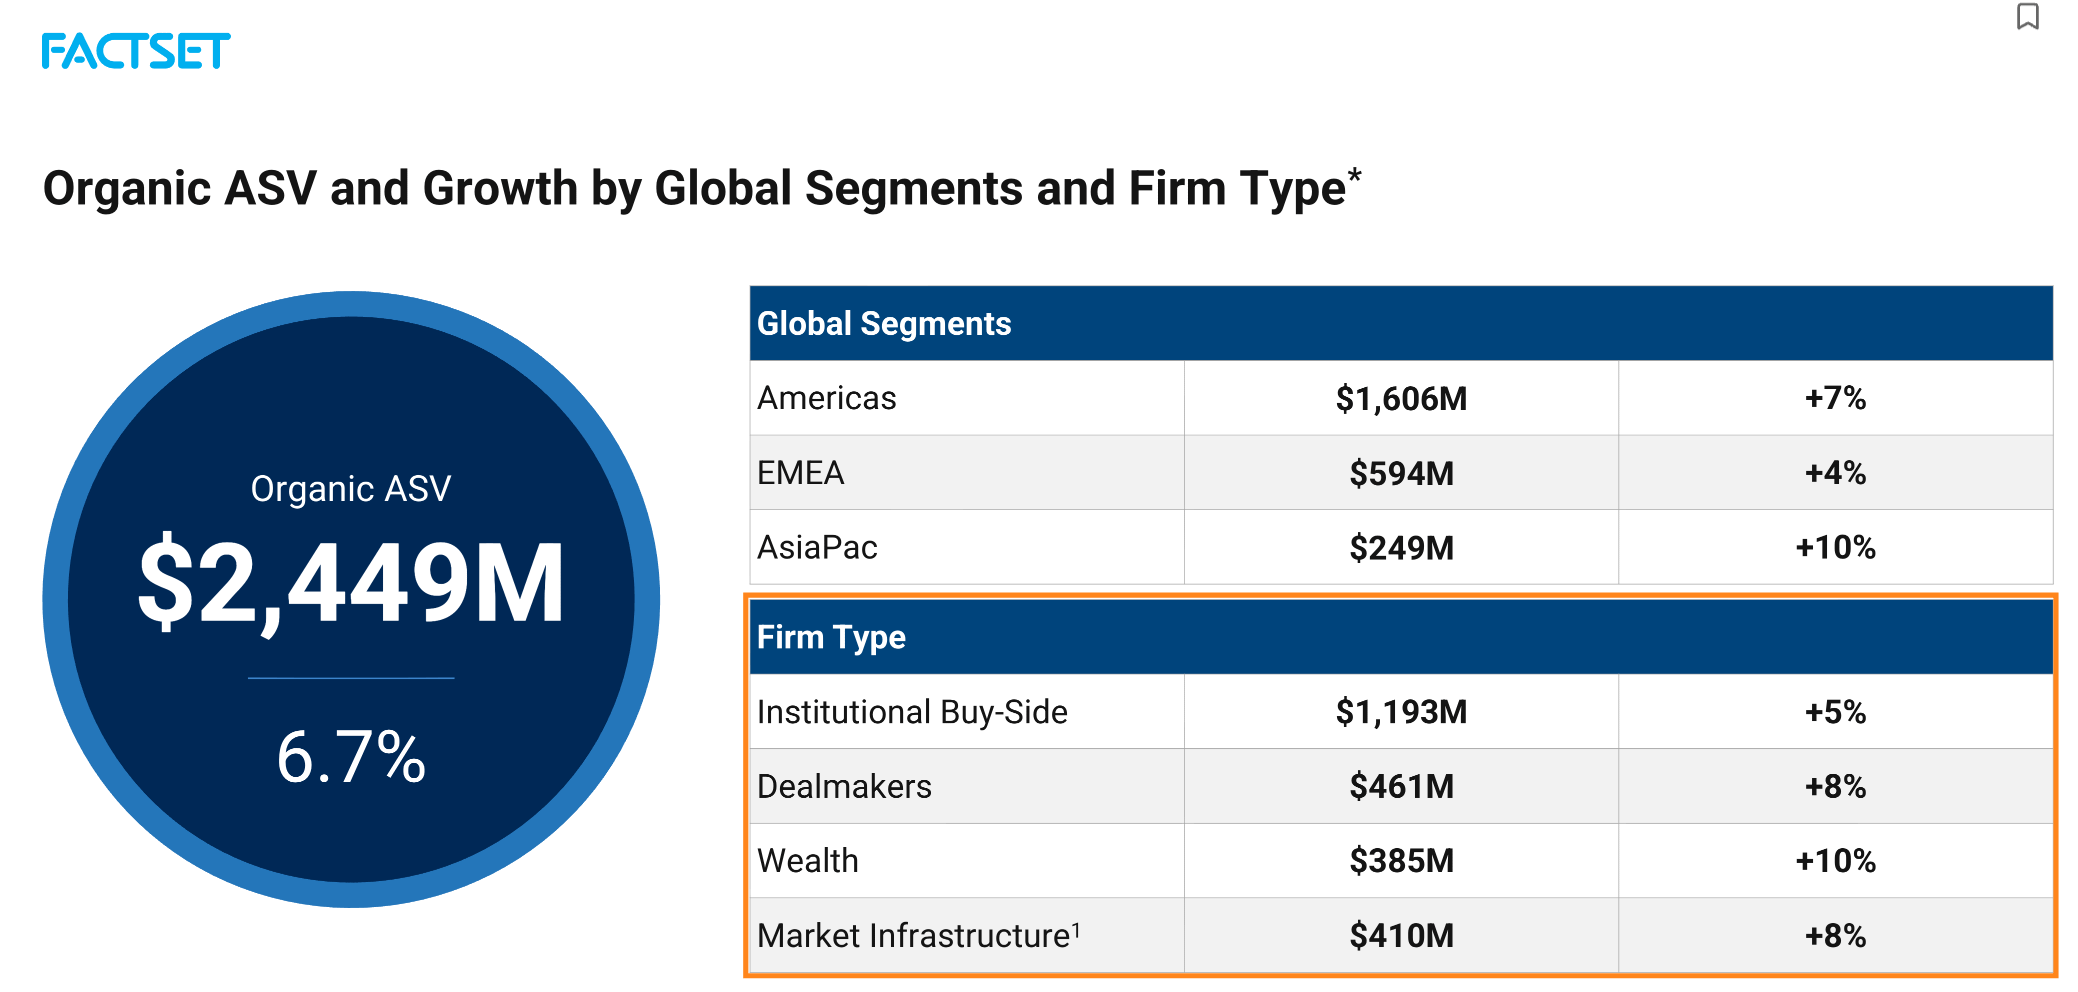
The key metric is ASV (Annual Subscription Value): it represents the next 12 months of revenue from all active subscriptions. As of February 28, 2026, organic ASV stood at $2,449.1 million, up 6.7% year-over-year.
The ASV retention rate exceeds 95%: meaning FactSet loses less than 5% of its annual revenue to attrition. That is exceptional.
The client retention rate is 91%, lower because it includes small long-tail clients.
The average client relationship lasts 16 years according to the investor presentation.
Helen Shan, the CFO, sums it up well during the Q2 2026 conference call: “These results reflect the mission-critical nature of our business as the world’s leading financial institutions continue to trust FactSet.”
The Acquisition Philosophy: Targeted, Not Compulsive
FactSet is not a frantic serial acquirer. The company makes strategic and targeted acquisitions to fill gaps in its offering:
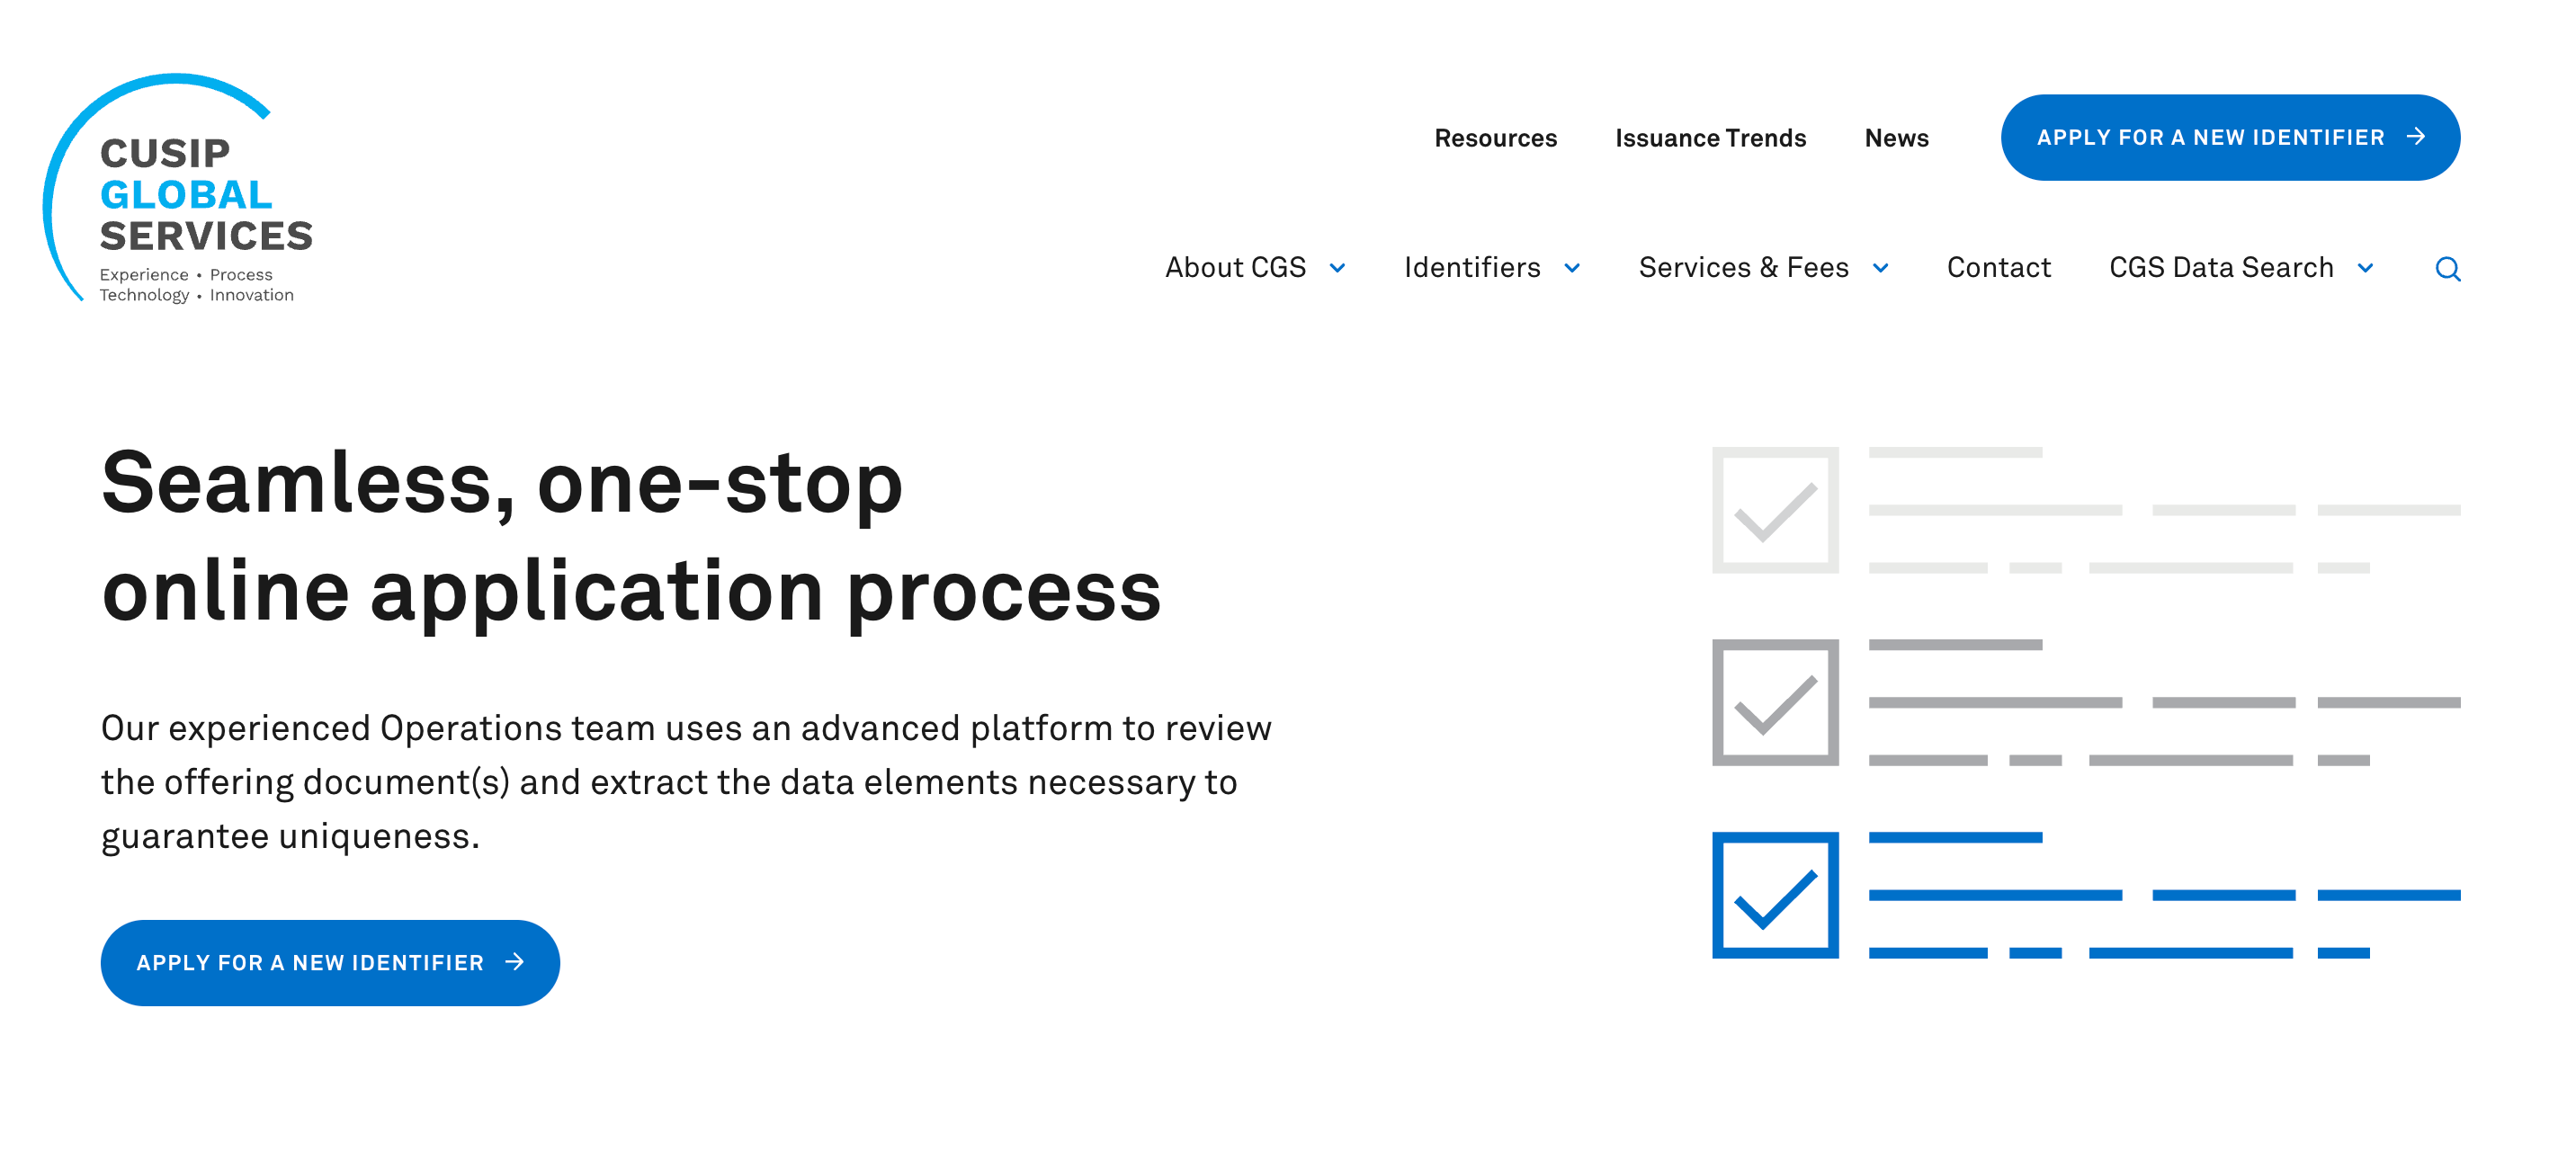
CUSIP Global Services (CGS) acquired in 2022 for ~$1.9 billion (the crown jewel: the global monopoly on CUSIP financial security identifiers).
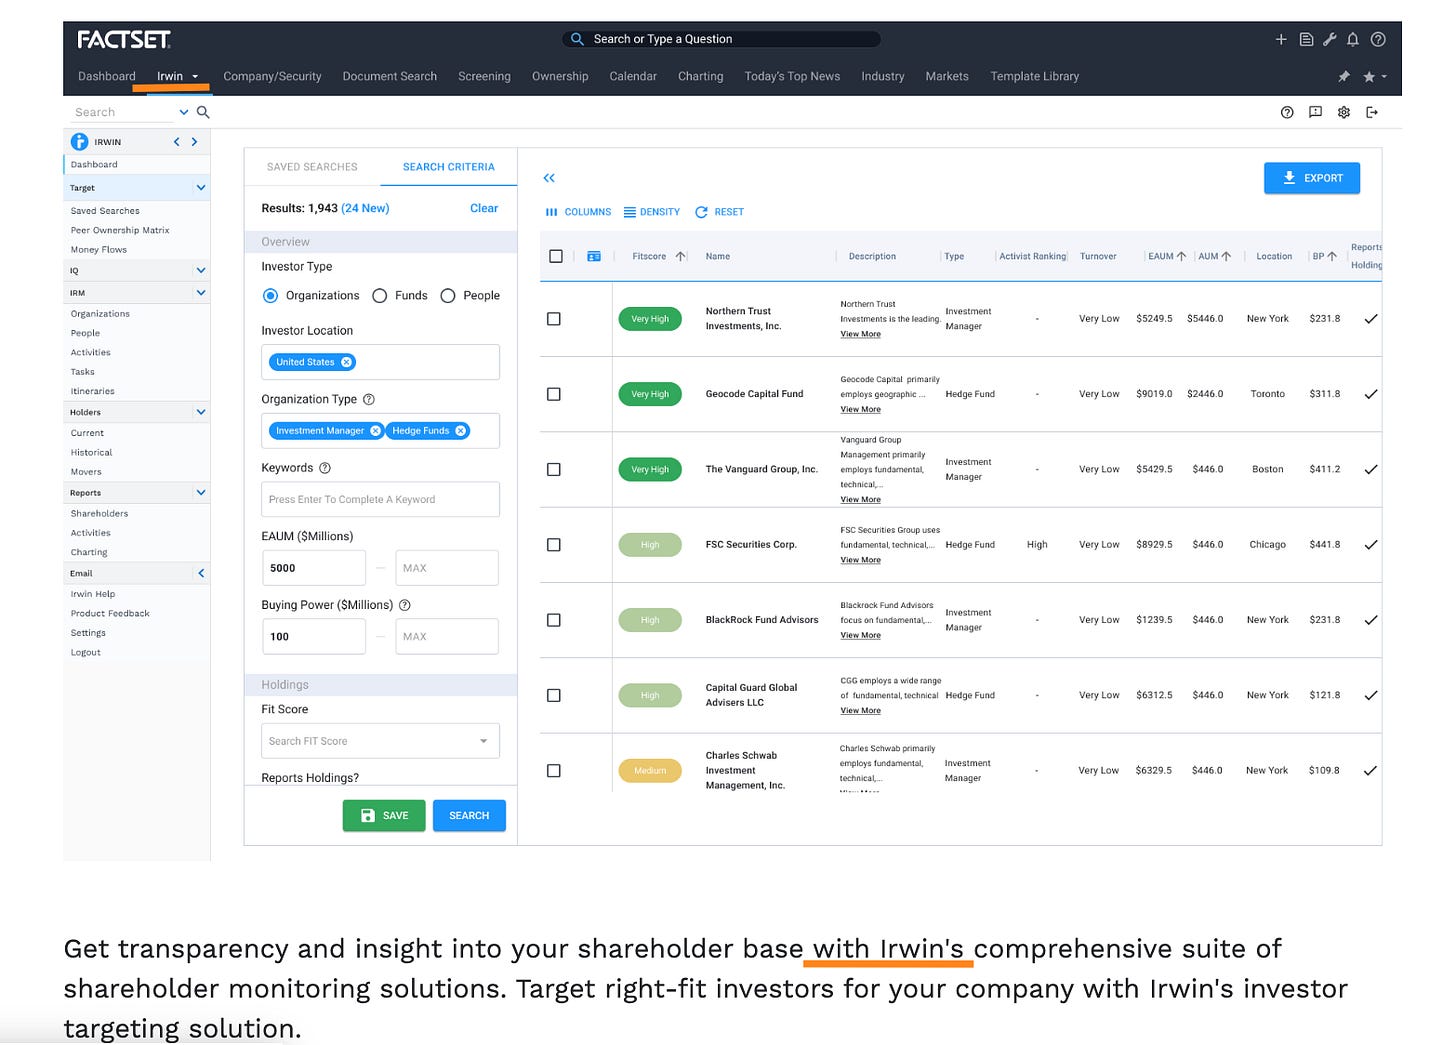
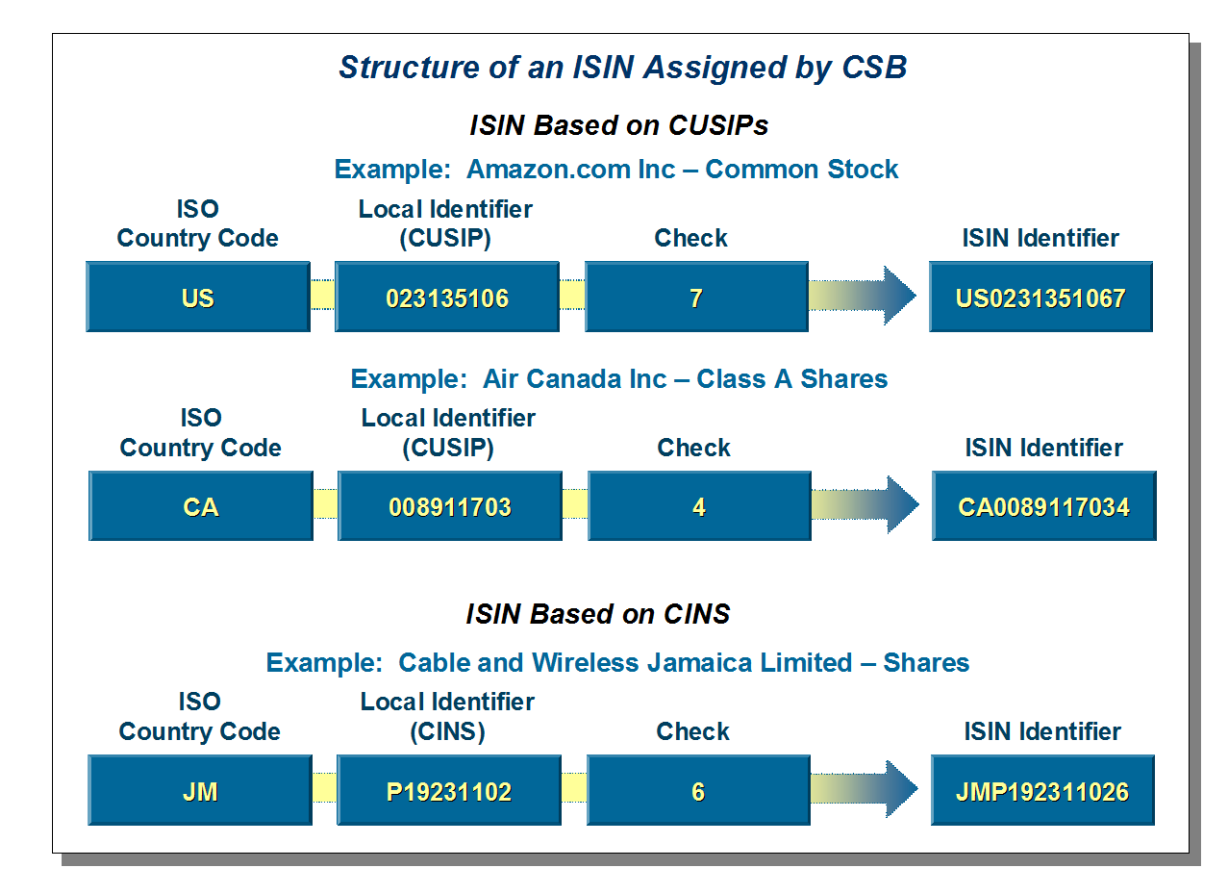
Irwin in November 2024 for $120.2 million (investor relations platform).
LiquidityBook in February 2025 for $247 million (cloud-native trading solutions, OMS).
The CUSIP acquisition is particularly interesting: it is a natural monopoly. Every financial security in the world needs a CUSIP identifier. It is the equivalent of a toll booth on the highway of global finance.
The Silent Monopoly: What Is CUSIP?
Imagine that every human being on Earth needs a Social Security number to exist administratively. No number, no identity, no rights: you simply do not exist in the system.
CUSIP is exactly the same thing, but for financial securities.
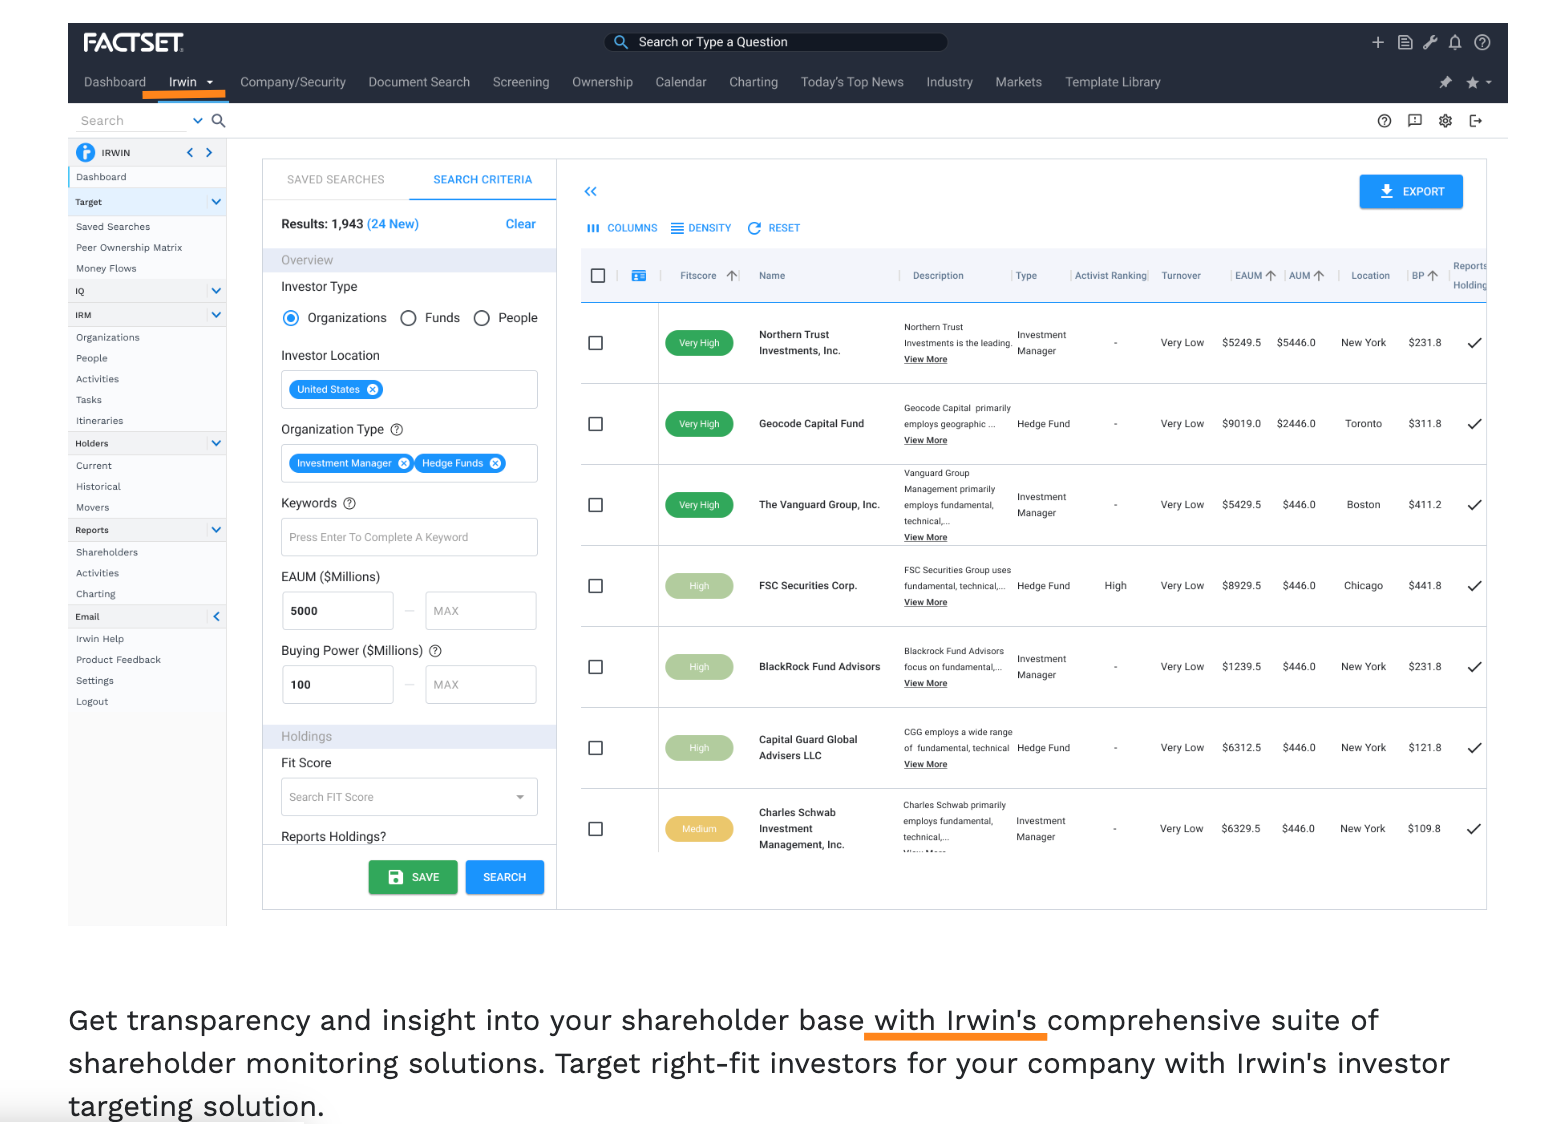
CUSIP stands for Committee on Uniform Security Identification Procedures. It is a system of 9-character alphanumeric identifiers assigned to every financial security issued in the United States and Canada: stocks, bonds, funds, derivatives, Treasury bills… everything. Without a CUSIP identifier, a financial security simply cannot be traded, cleared, or settled on North American markets. It does not exist in the eyes of the financial system.
Internationally, the equivalent system is called CINS (CUSIP International Numbering System), and the same operator manages it.
And that sole operator is CUSIP Global Services (CGS), which has belonged to FactSet since March 2022.
In practice, every time a company issues a new share, every time a state or municipality issues a bond, every time a new fund is created, a CUSIP identifier is required. And there is only one window to get it. It is a pure monopoly, historically overseen by the American Bankers Association and now commercially operated by FactSet.
A Real Estate Analogy
To give you an analogy in real estate that you know well: it is as if a single company in the world held the exclusive right to assign cadastral numbers to every plot of land. No cadastral number, no transaction possible. The owner of this system collects at every transaction, every issuance, every new plot created, without ever needing to prospect a single client.
This is why CUSIP is often described as a “permanent toll on financial markets.” The revenues are recurring by nature, growth is structural (because new securities are issued constantly), and competition is nonexistent by definition. AI cannot “disrupt” a regulatory monopoly: there is nothing to replace, nothing to optimize. The number is the number.
FactSet paid approximately $1.9 billion to acquire this asset. At the time of purchase, CUSIP generated roughly $175 million in annual revenue. Today, the Market Infrastructure segment (which includes CUSIP) shows an ASV of $410 million with +8% growth. It is probably the most valuable and most defensive asset in FactSet’s entire portfolio.
Equities 123 is a reader-supported publication. To receive new posts and support my work, consider becoming a free or paid subscriber.
Management Quality and Governance
A CEO Change in the Midst of Transformation
The most important point here: FactSet has a new CEO since May 2025. Sanoke Viswanathan replaced Phil Snow after more than 10 years at the helm. Viswanathan comes from JPMorgan Chase, where he was CEO of International Consumer and Wealth and a member of JPMorgan’s Operating Committee.
Sanoke Viswanathan
He is a tech and transformation profile, not a “pure finance” profile. And listening to the Q2 2026 transcript, it is palpable. Viswanathan talks about AI agents, MCP servers, coding assistants that automate 1/5 of code commits, about a 90% reduction in effort on software maintenance tasks. He does not talk like a banker. He talks like a CTO.
My take: This is probably exactly what FactSet needed. The industry is in the midst of a massive technological shift, and having a CEO who deeply understands tech (rather than a pure commercial leader) is a structural advantage. However, transformation CEOs also carry a risk: they can overinvest, underestimate operational complexity, or lose sight of short-term profitability.
Skin in the Game: A Point of Attention
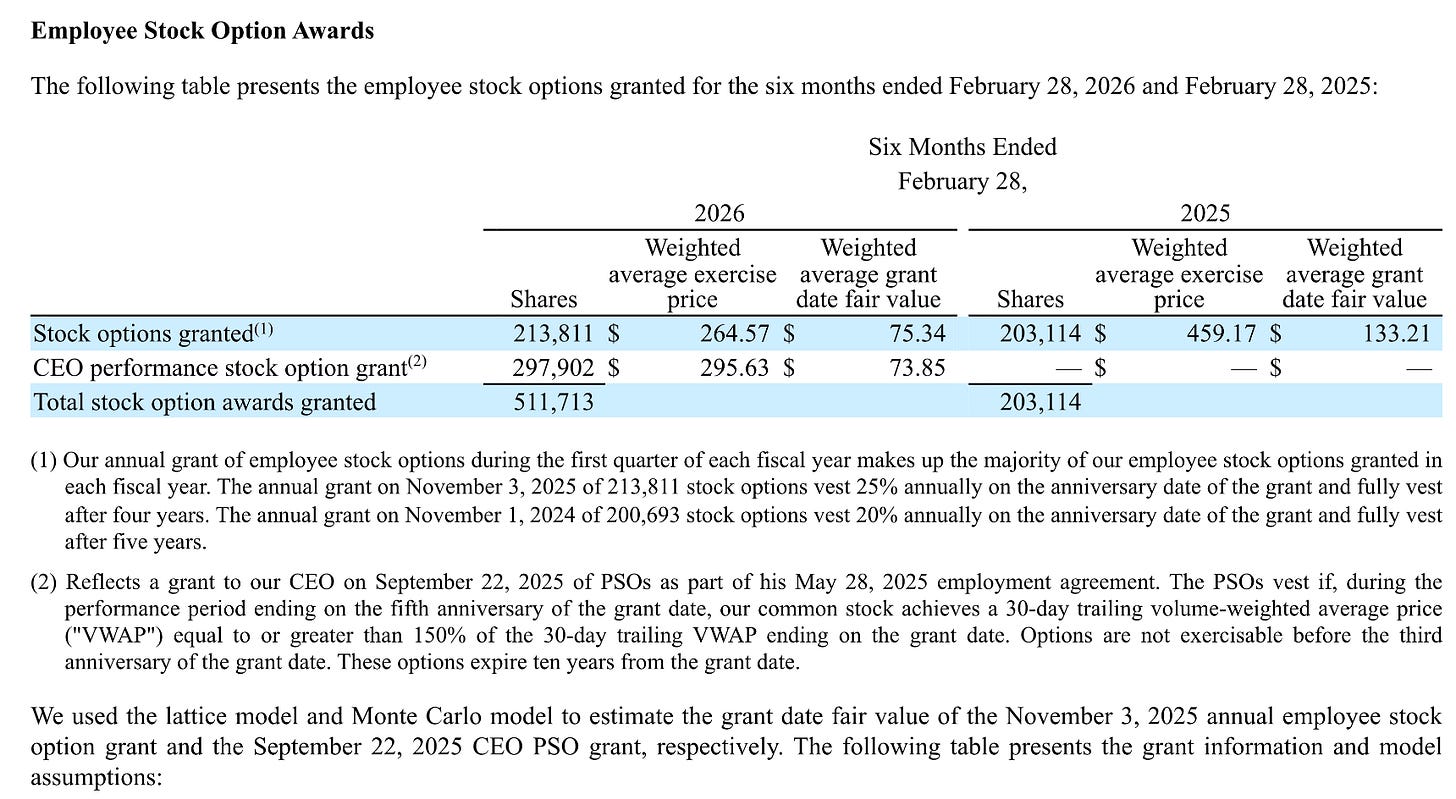
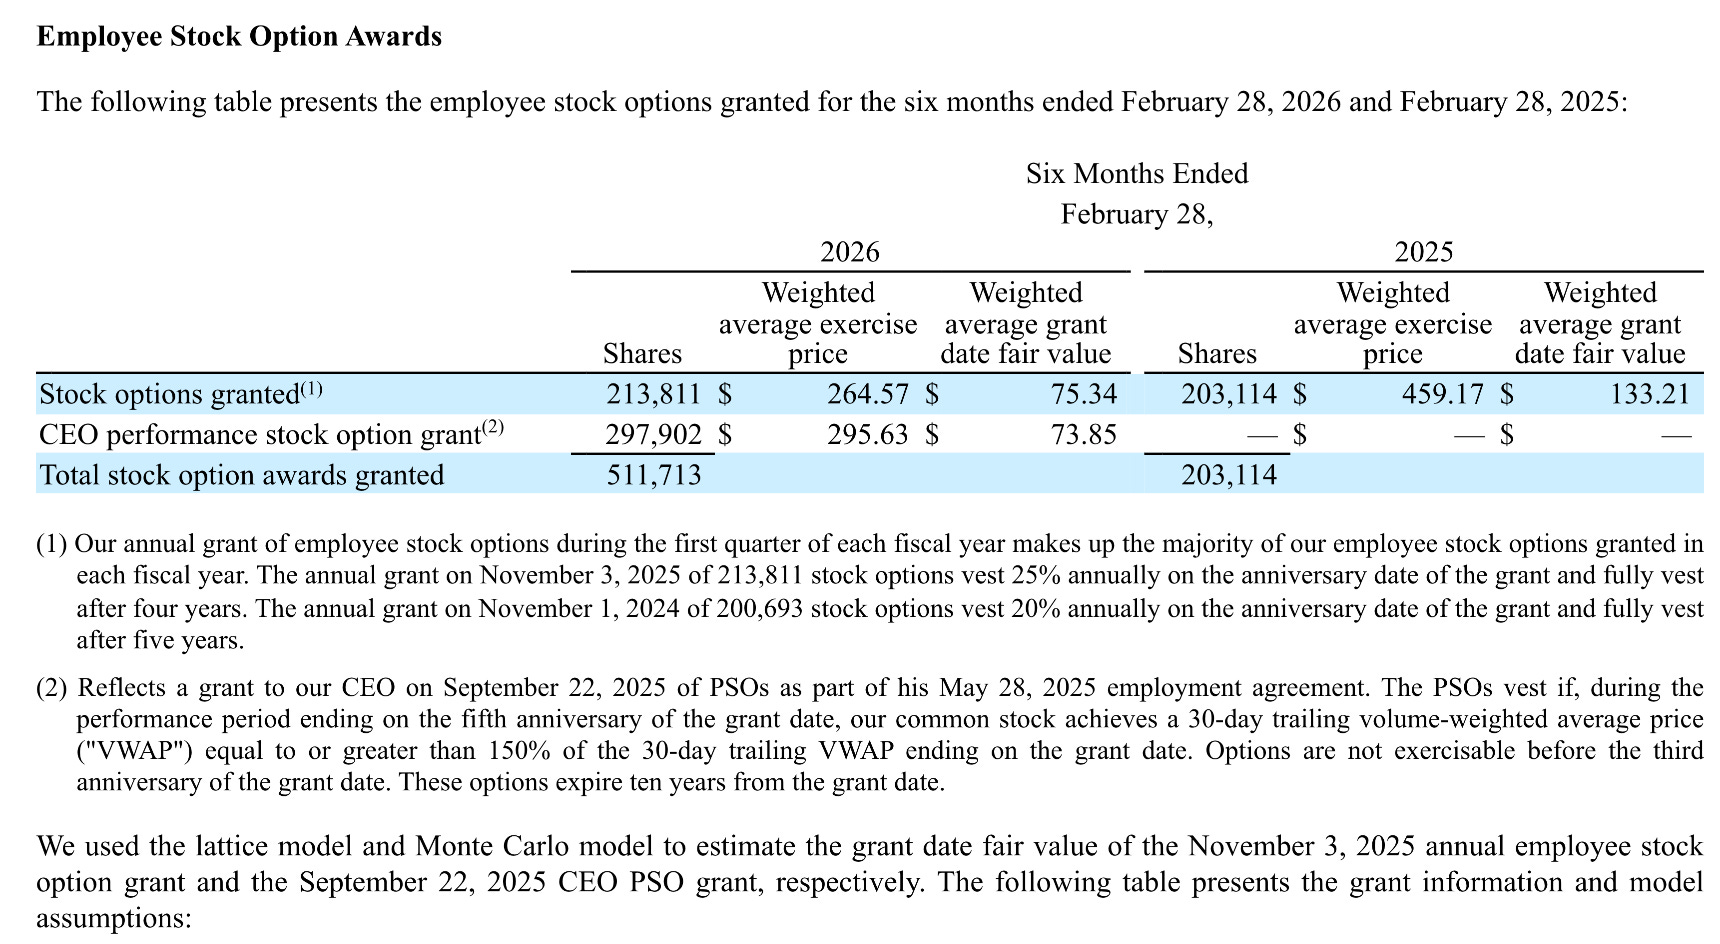
The new CEO received significant compensation packages as part of his recruitment:
Performance Stock Options (PSOs): they vest only if the stock price reaches 150% of the reference price on a 30-day VWAP, within 5 years of grant. This is aligned with shareholders: if the stock does not rise significantly, he gets nothing.
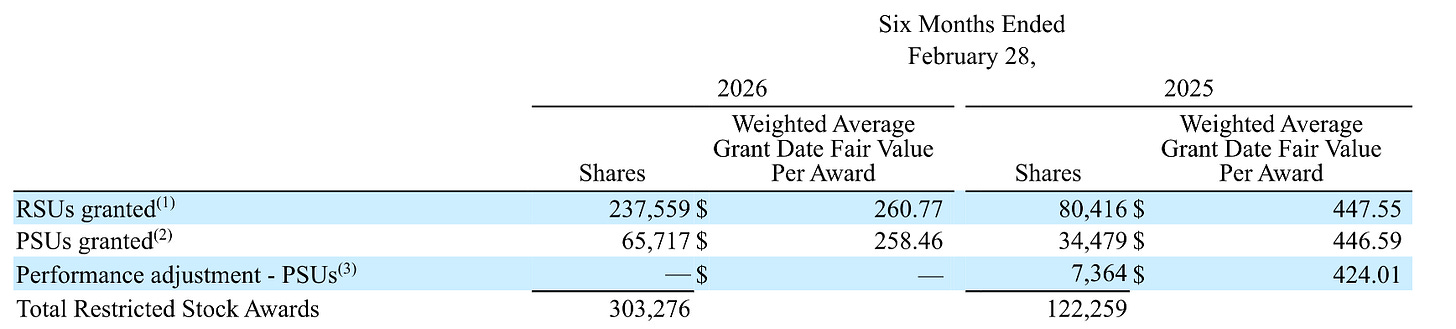
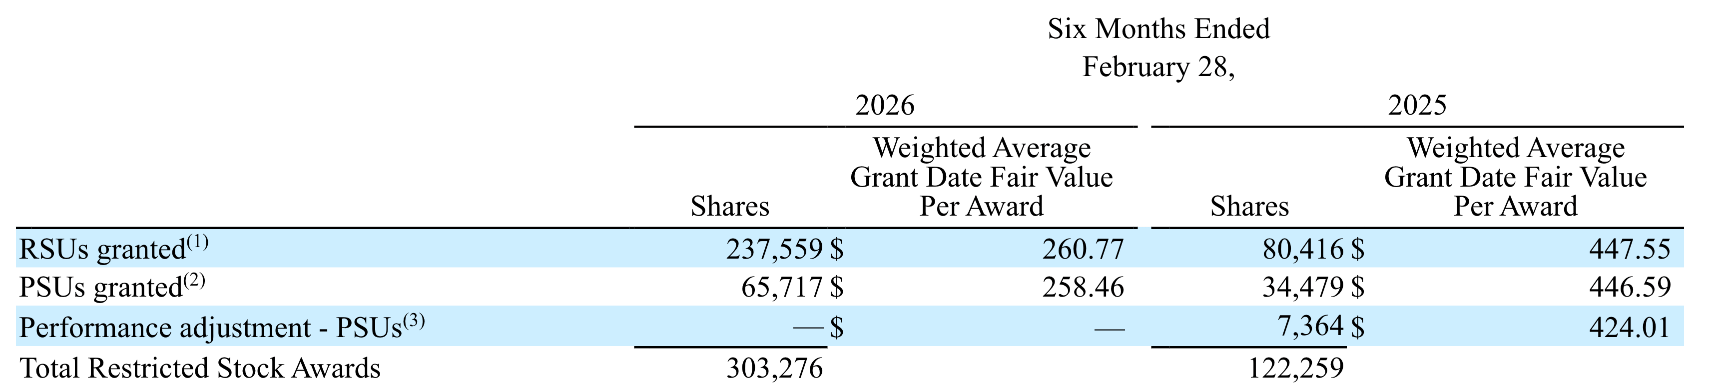
RSUs (58,332 units) and PSUs (22,436 units): PSUs depend on achieving performance targets.
One-time cash awards (make-whole) that impacted GAAP margins by approximately ~$25 million on FY2026.
The CEO’s compensation represents an impact of about 150 bps on the GAAP margin in FY2026. That is not negligible, but it is largely a one-time effect tied to the recruitment.
In terms of alignment: the PSOs at 150% of the reference price are a good signal. The CEO only wins big if shareholders win big. That is far better than at-the-money stock options that reward mediocrity.
Rating: ⭐⭐⭐⭐
Financial Communication Transparency
FactSet publishes:
A complete GAAP / Non-GAAP reconciliation with every earnings release.
A decomposition of organic vs. acquired growth (a best practice that many compounders do not follow).
Acquisition details with price, goodwill, and identified intangibles.
ASV by geographic segment AND by firm type (Institutional Buy-Side, Dealmakers, Wealth, Market Infrastructure).
What is missing: the realized ROIC on past acquisitions is not individually reported. That is unfortunate but standard for the sector. We also do not know the exact multiples paid beyond what is disclosed in the financial statement notes.
Financial Communication Rating: ⭐⭐⭐⭐
Above average. The organic/acquired decomposition and the ASV metric are best practices. But management could go further on acquisition ROIC.
The Material Weakness in Internal Controls: A Red Flag?
⚠️ ALERT: MATERIAL WEAKNESS IN IT INTERNAL CONTROLS
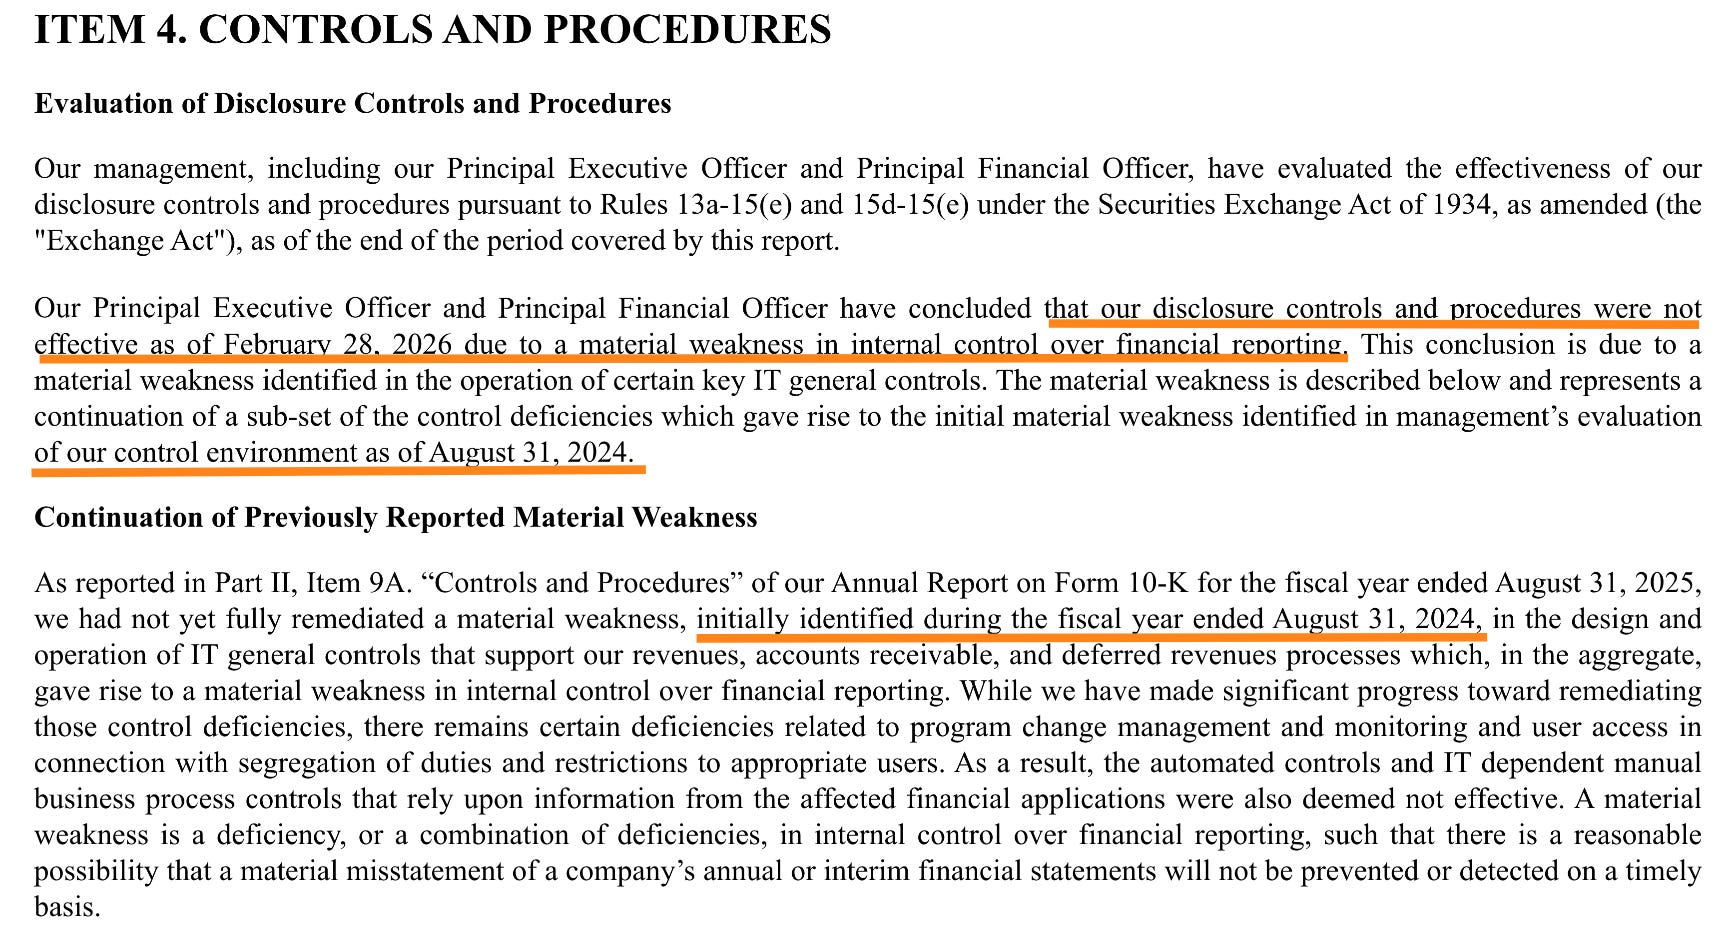
The 10-Q for Q2 FY2026 reveals that FactSet has an unresolved material weakness in its IT internal controls (ITGC), initially identified in August 2024 and still not fully remediated as of February 28, 2026.
The issue concerns program change management controls and access control/segregation of duties in systems supporting revenue processes, accounts receivable, and deferred revenue.
What this means in practice: there is a theoretical risk that a material error in revenue recognition may not be detected in time. The company has engaged third-party audit firms, hired a global head of internal audit, and implemented enhanced controls, but the remediation is not complete.
Impact for shareholders: the risk is more reputational and operational than financial in the short term. No material errors have been identified in the financial statements. But a material weakness persisting for over 18 months is unusual for an S&P 500 company and signals weaknesses in internal IT infrastructure.
Internal Controls Rating: ⭐⭐⭐
Remediation underway, no fraud identified, but the resolution timeline is too long.
Financial Performance: The Numbers That Matter
Revenue and Organic Growth
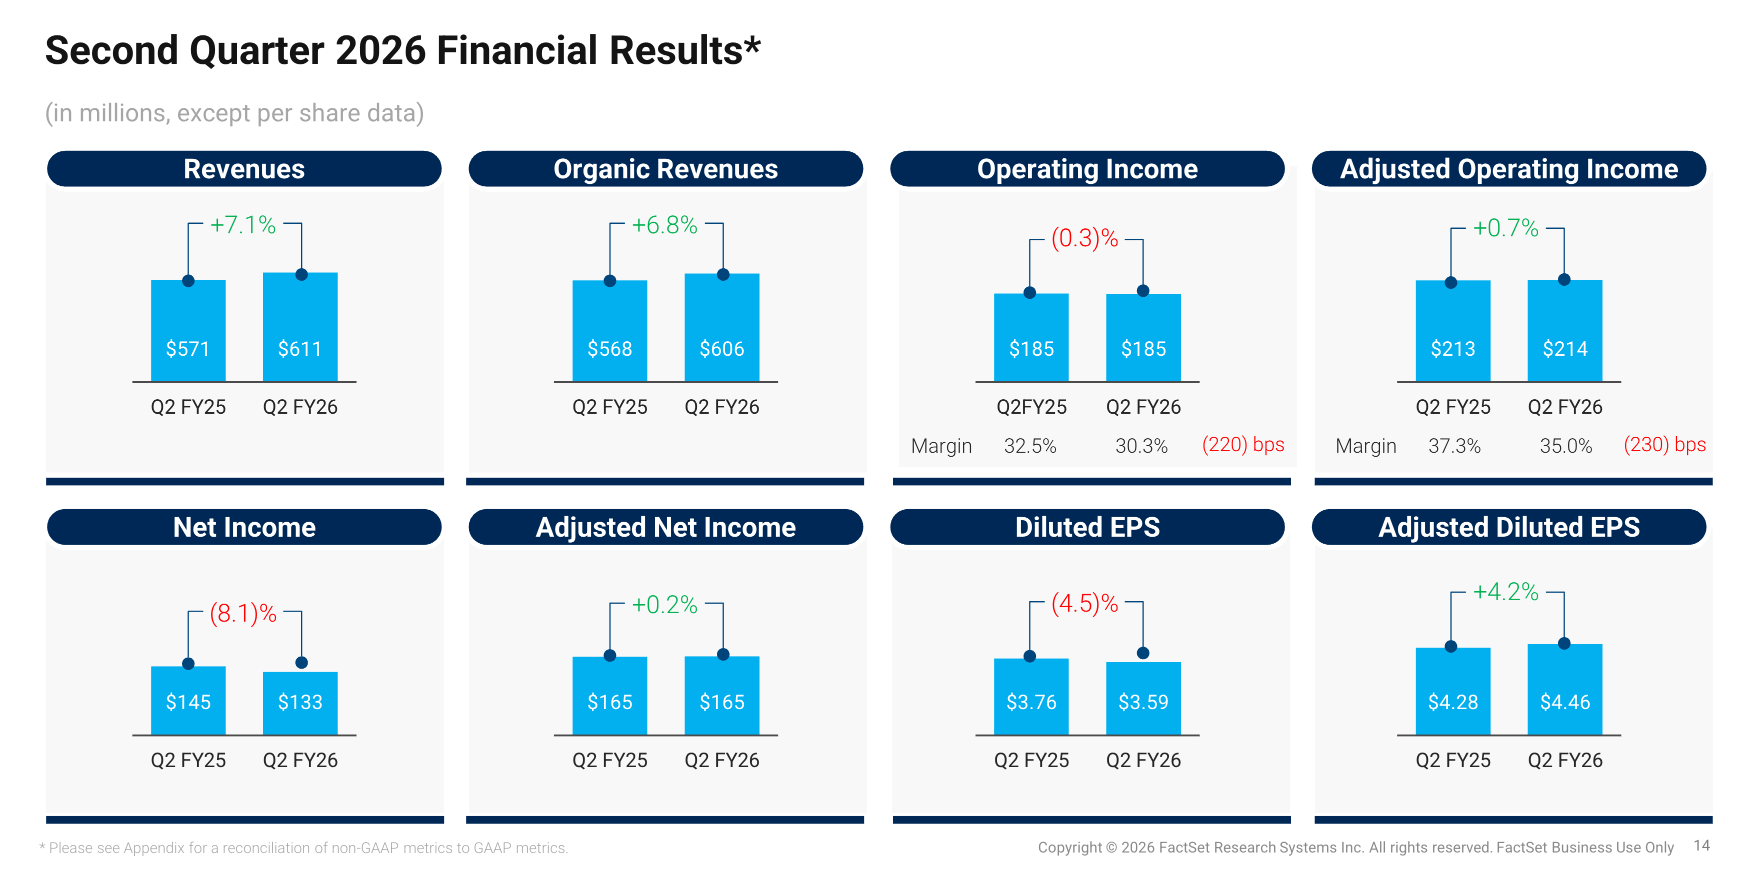
GAAP revenues for Q2 FY2026 came in at $611 million, up 7.1% year-over-year. Organic growth (excluding acquisitions, divestitures, and currency) was 6.8%.
Over H1 FY2026: revenues of $1,218.6 million, up 7.0%, with organic growth of 6.4%.
Growth has accelerated for the fourth consecutive quarter since Viswanathan’s arrival. Organic ASV advanced $38 million over the last three months (Q2 FY2026), compared to a more modest quarterly pace previously.
Breakdown by Geography (Organic ASV Growth as of 02/28/2026)
Americas (66% of ASV): +7.0% The main engine, driven by workstations, data solutions, and trading.
EMEA (24% of ASV): +4.3% More modest, with some weakness among asset owners (pension reform in the Netherlands).
Asia Pacific (10% of ASV): +10.0% The most dynamic segment, driven by hedge funds and middle-office solutions.
Breakdown by Firm Type
Institutional Buy-Side ($1,193M, 49% of ASV): +5% Acceleration from +4% in Q1.
Dealmakers ($461M, 19%): +8% Strong acceleration vs. +6% in Q1, driven by competitive displacements in banking.
Wealth ($385M, 16%): +10% Remarkable performance, despite a high comparison base (UBS win in the prior year).
Market Infrastructure ($410M, 17%): +8% Solid, driven by real-time data and CUSIP.
My analysis: Organic growth of 6.7% is good but not exceptional for a financial data provider in the current cycle. S&P Global posts similar or slightly higher organic growth. What is encouraging is the acceleration: four consecutive quarters of improving growth rates. What is less encouraging is that this acceleration is partly driven by pricing effects (annual price increases in North America) rather than pure organic volume.
Growth Rating: ⭐⭐⭐⭐
Welcome acceleration, geographic and client-type diversification, but significant dependence on pricing.
Free Cash Flow: The Lifeblood of the Business
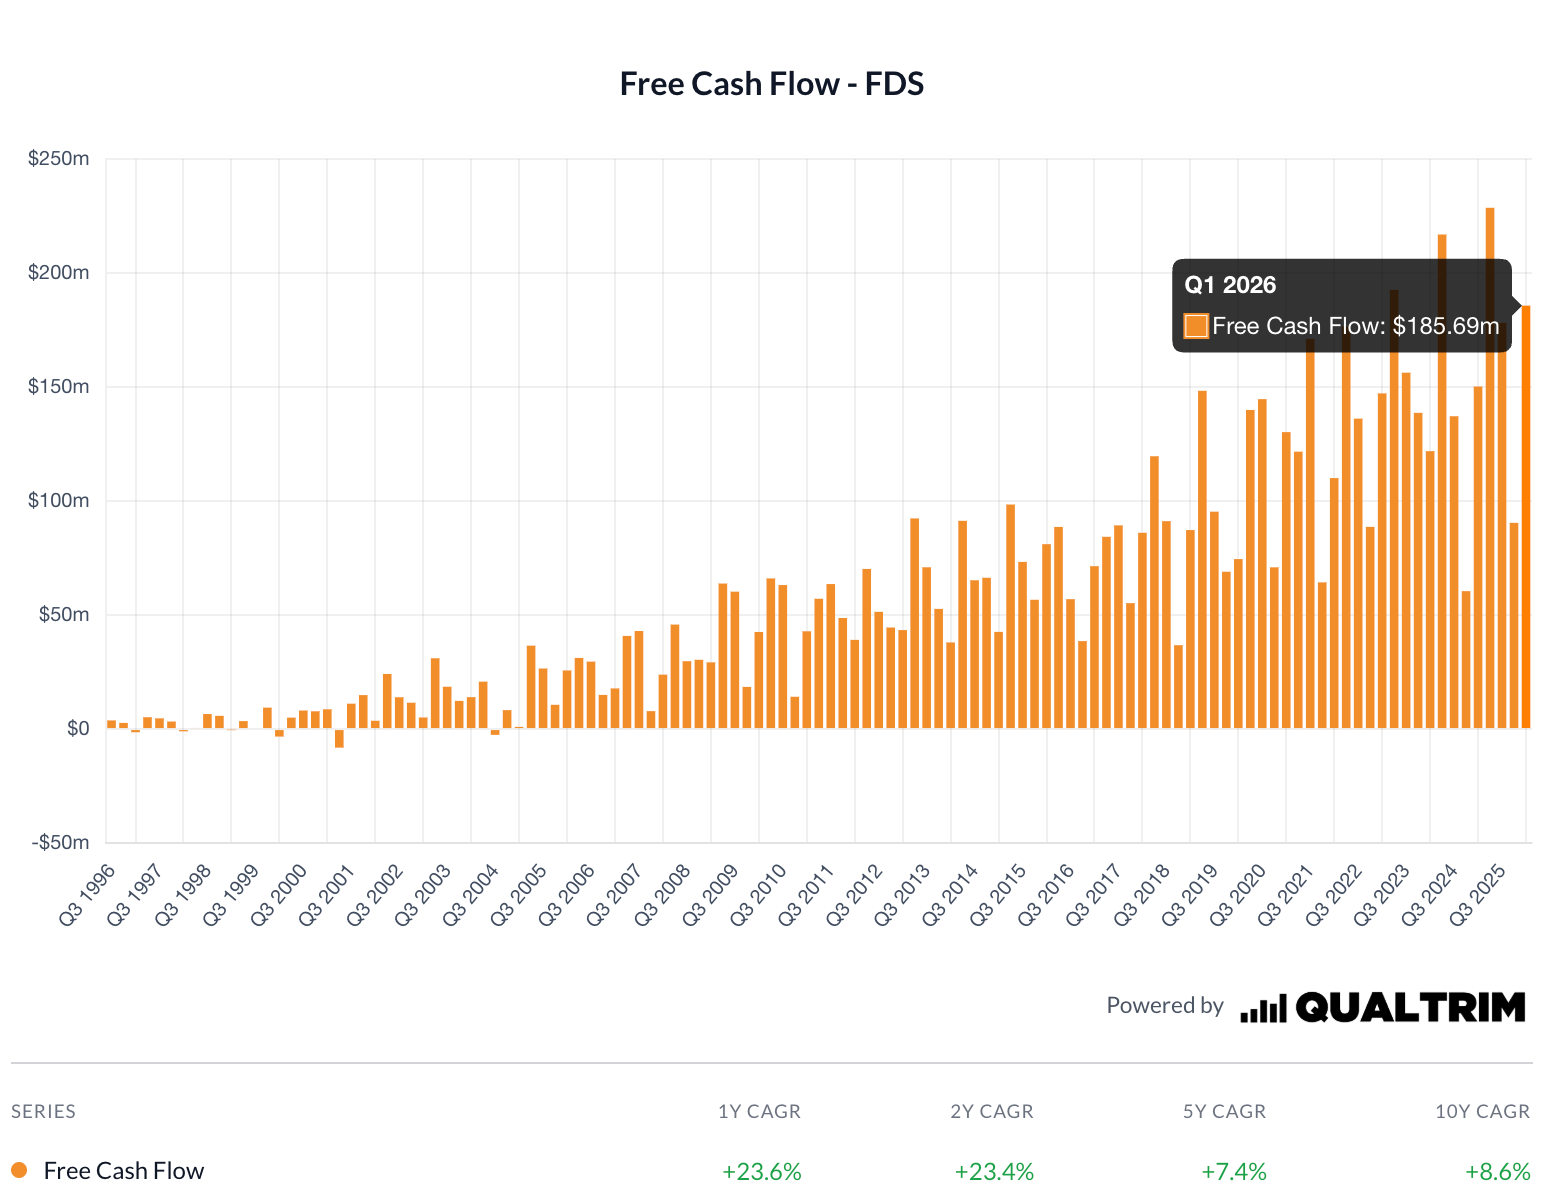
Quarterly FCF for Q2 FY2026 came in at $185.7 million, up 23.6% year-over-year. That is an excellent figure.
Over H1 FY2026: FCF was $276.1 million, compared to $210.7 million a year earlier, a 31% increase.
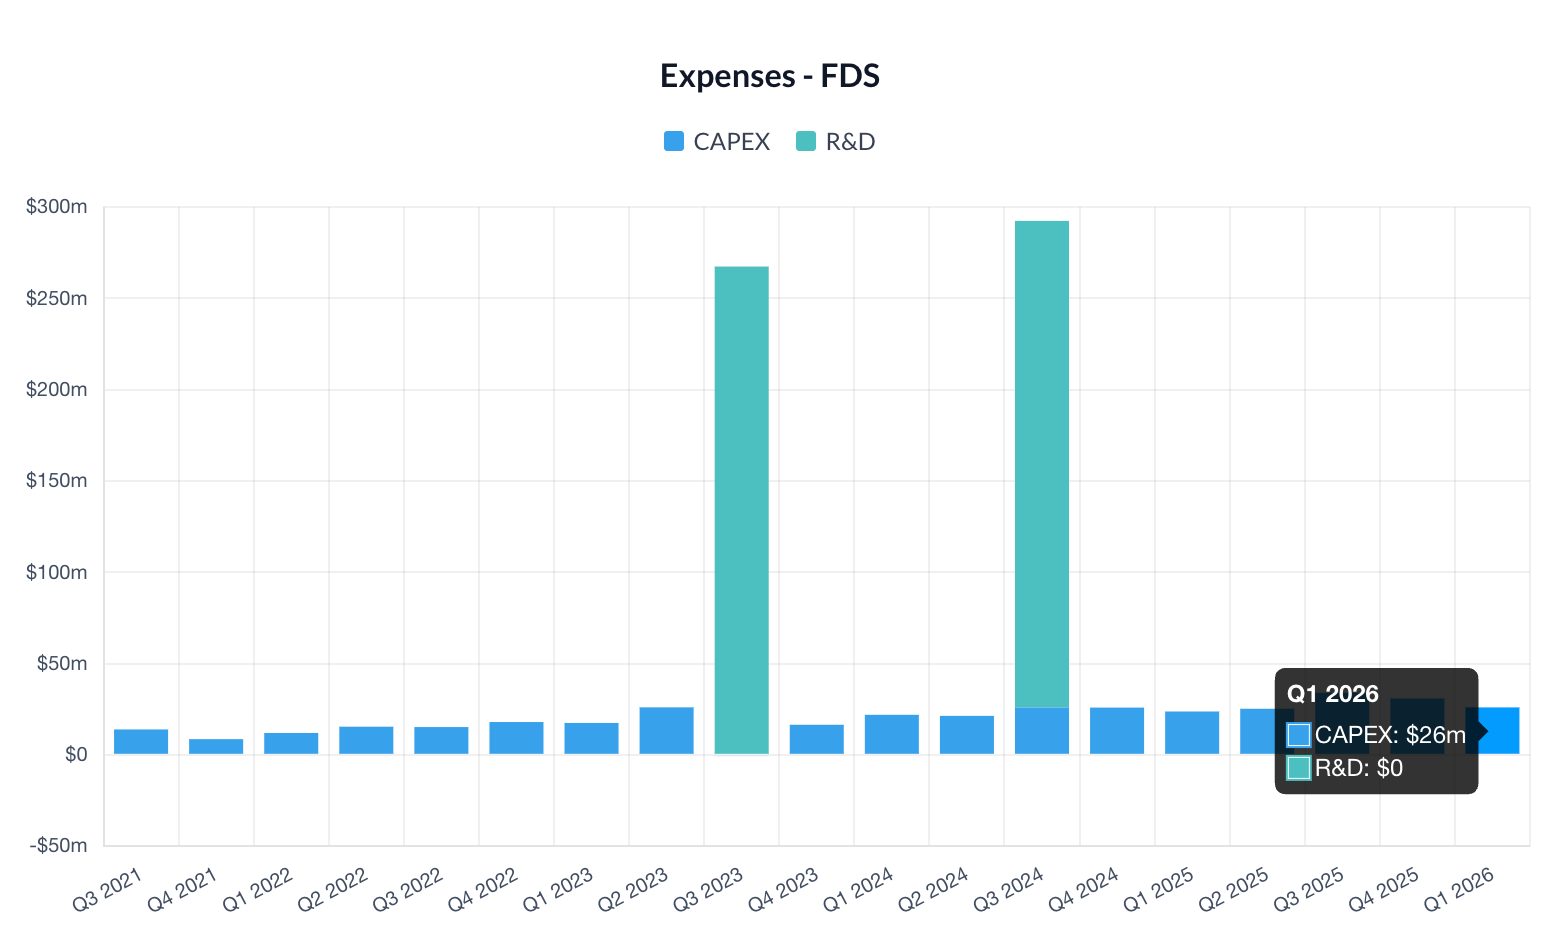
Cash flow from operations in Q2 was $211.7 million (+21.7%), with capex of $26 million (approximately 4.3% of revenues). Capex consists primarily of capitalized internal software development costs, which is typical for a SaaS/data company.
FCF Conversion (FCF / GAAP Net Income): In Q2, the $185.7M in FCF compares to a net income of $133.1M, yielding a ratio of 139%. That is excellent and is explained by non-cash charges (intangible amortization, investment depreciation). FCF is substantially higher than GAAP net income, confirming that the P/E is misleading.
Estimated Annual FCF for FY2026: annualizing H1 and accounting for seasonality, we can estimate annual FCF in the range of $550–580 million, which would yield an FCF Yield of approximately 6.6–7.0% on the current market cap of $8.3 billion. That is very solid for a company of this quality.
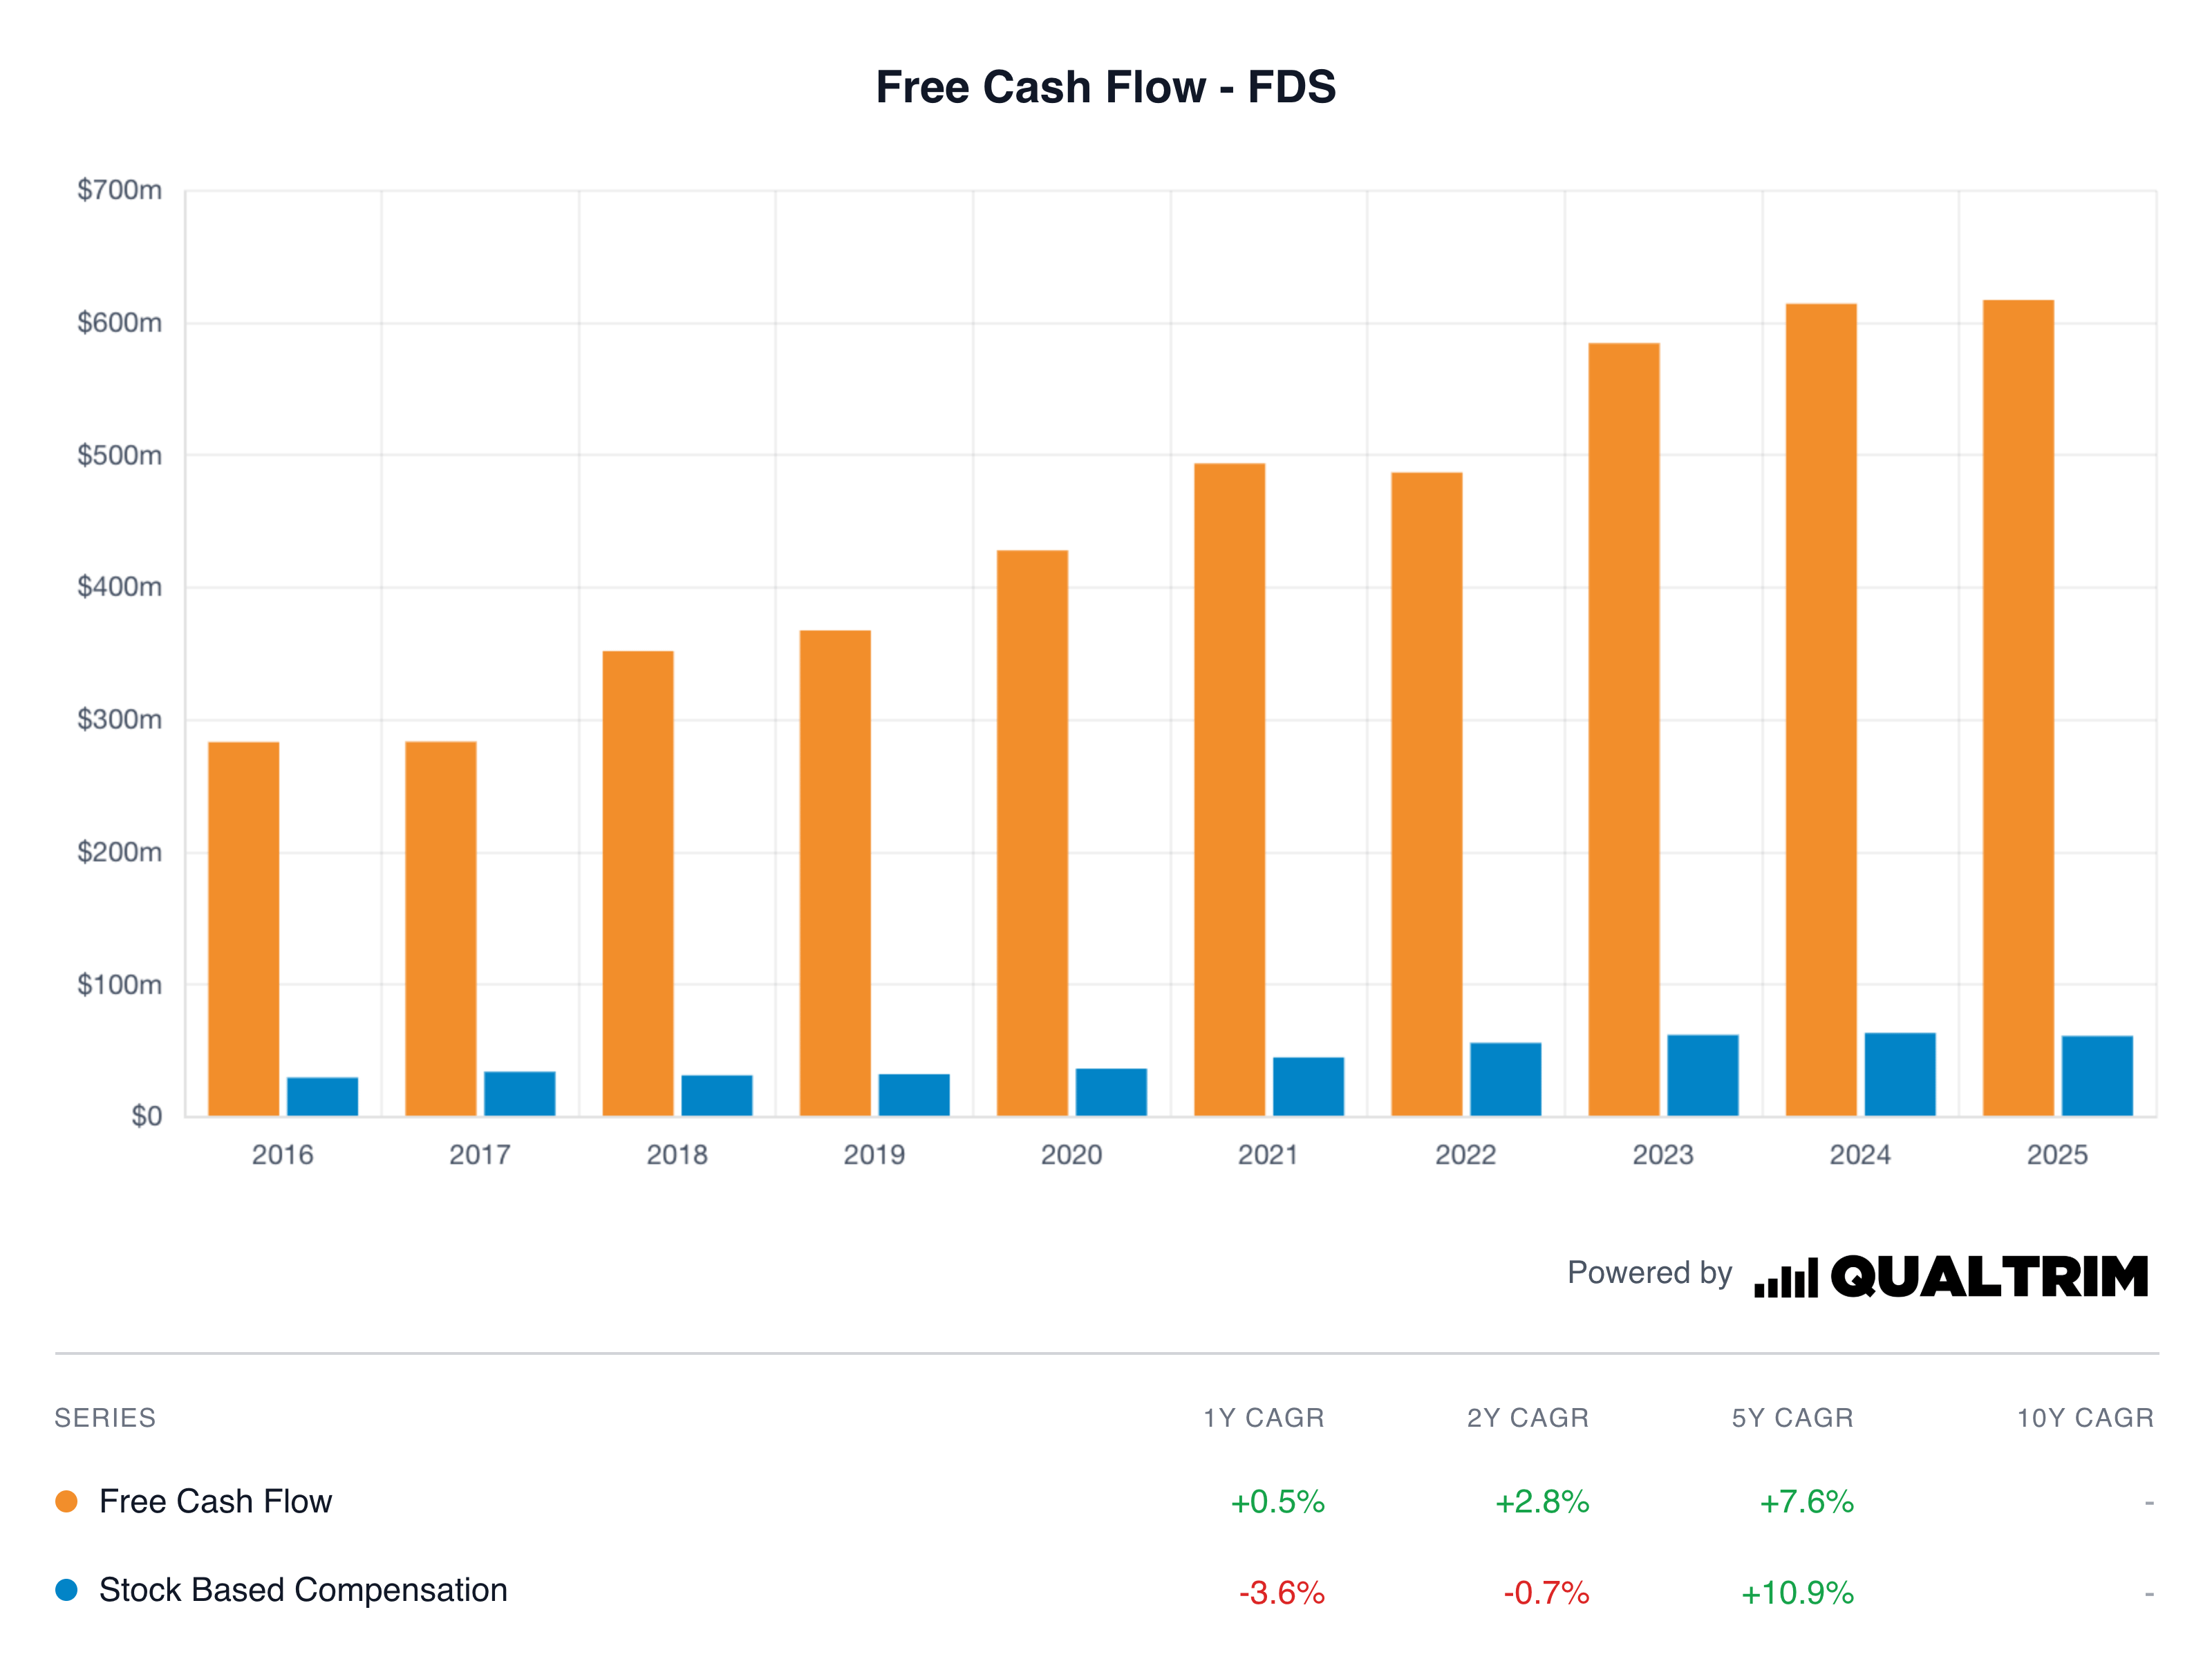
A nuance worth noting regarding stock-based compensation: while present, its volume has stagnated or even declined over the last two fiscal years, contrasting with the consistent progression of free cash flow.
FCF Rating: ⭐⭐⭐⭐⭐
Excellent conversion, FCF growing strongly, exceeding net income. This is the hallmark of a well-oiled cash machine.
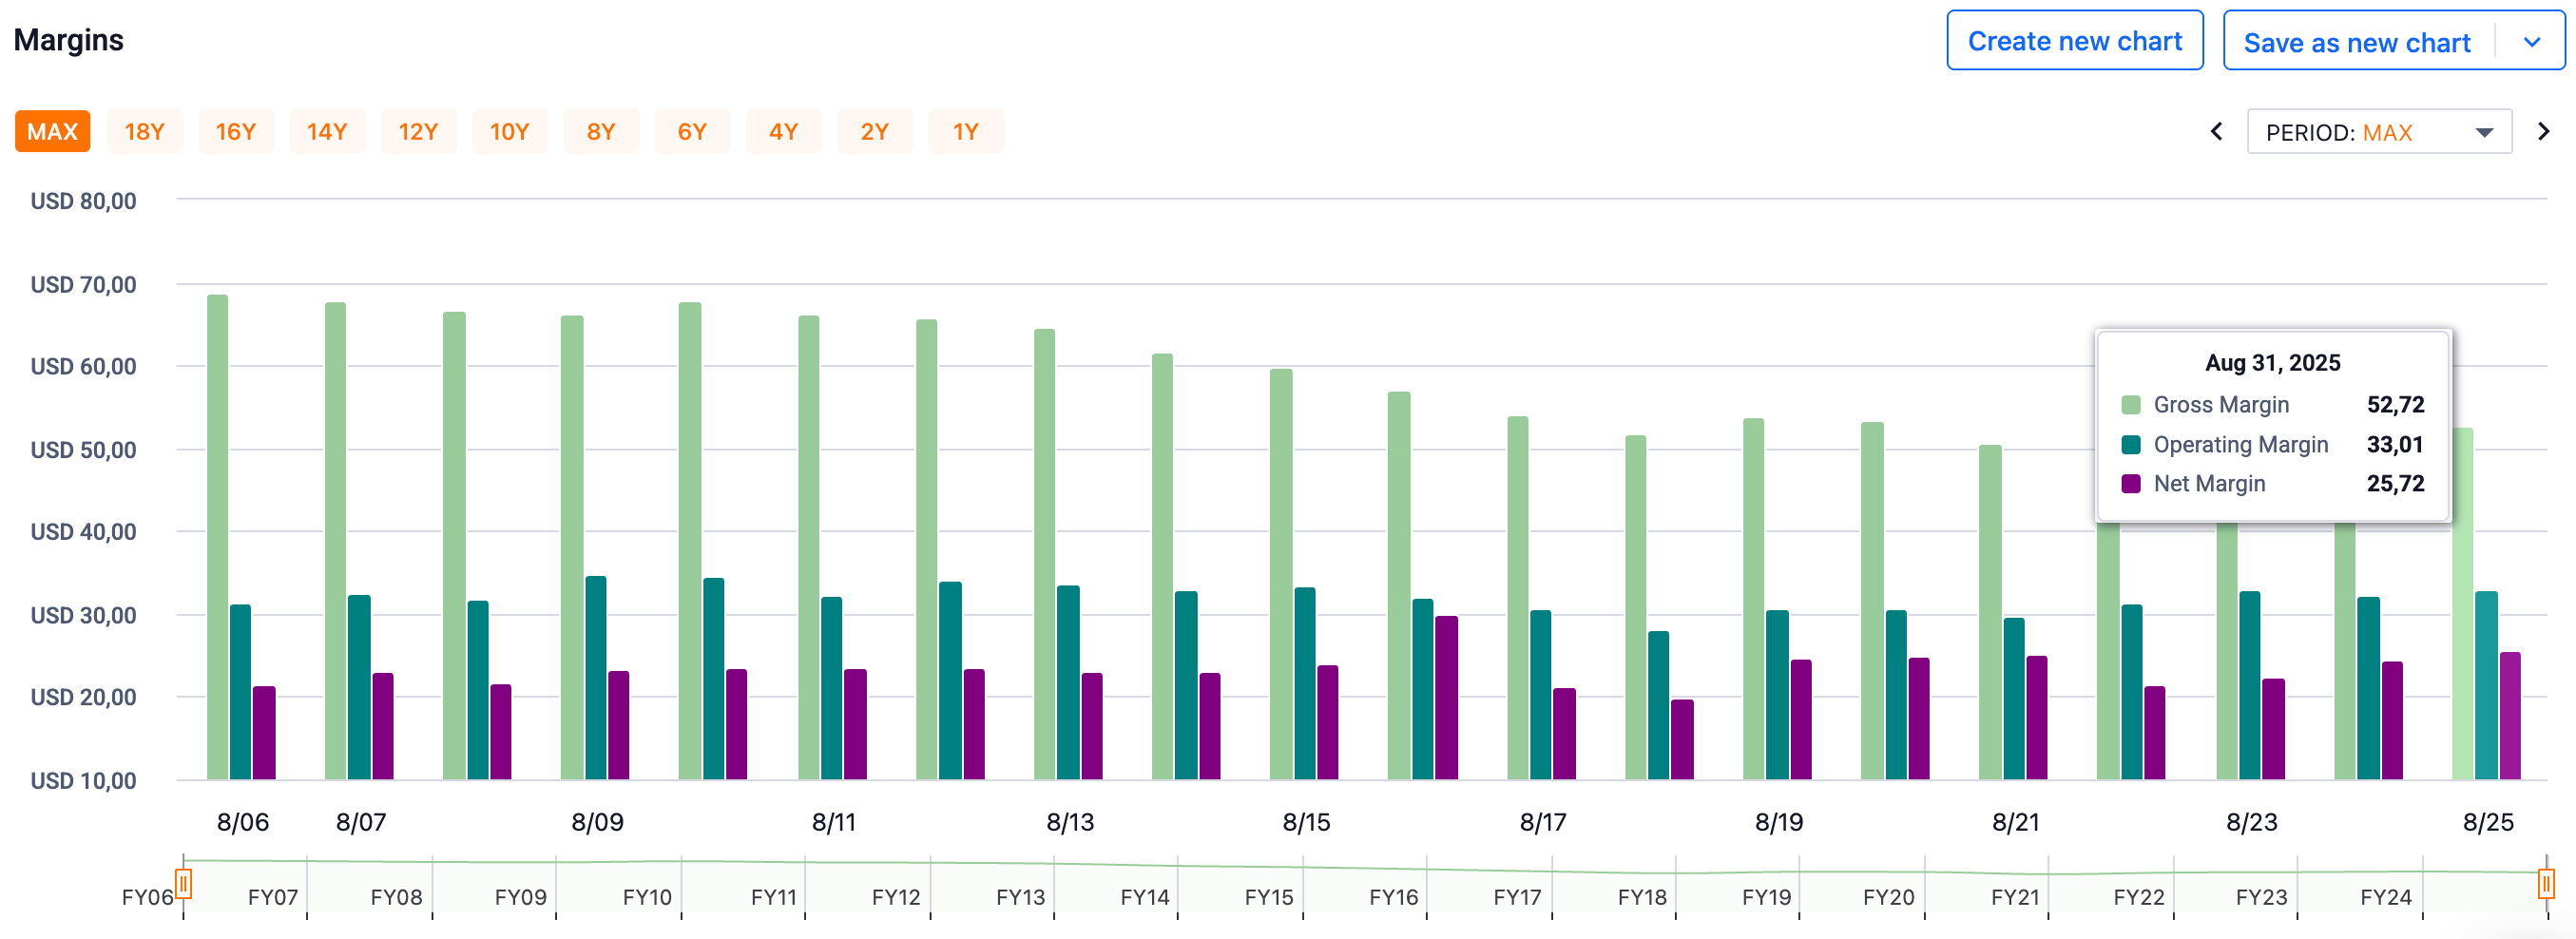
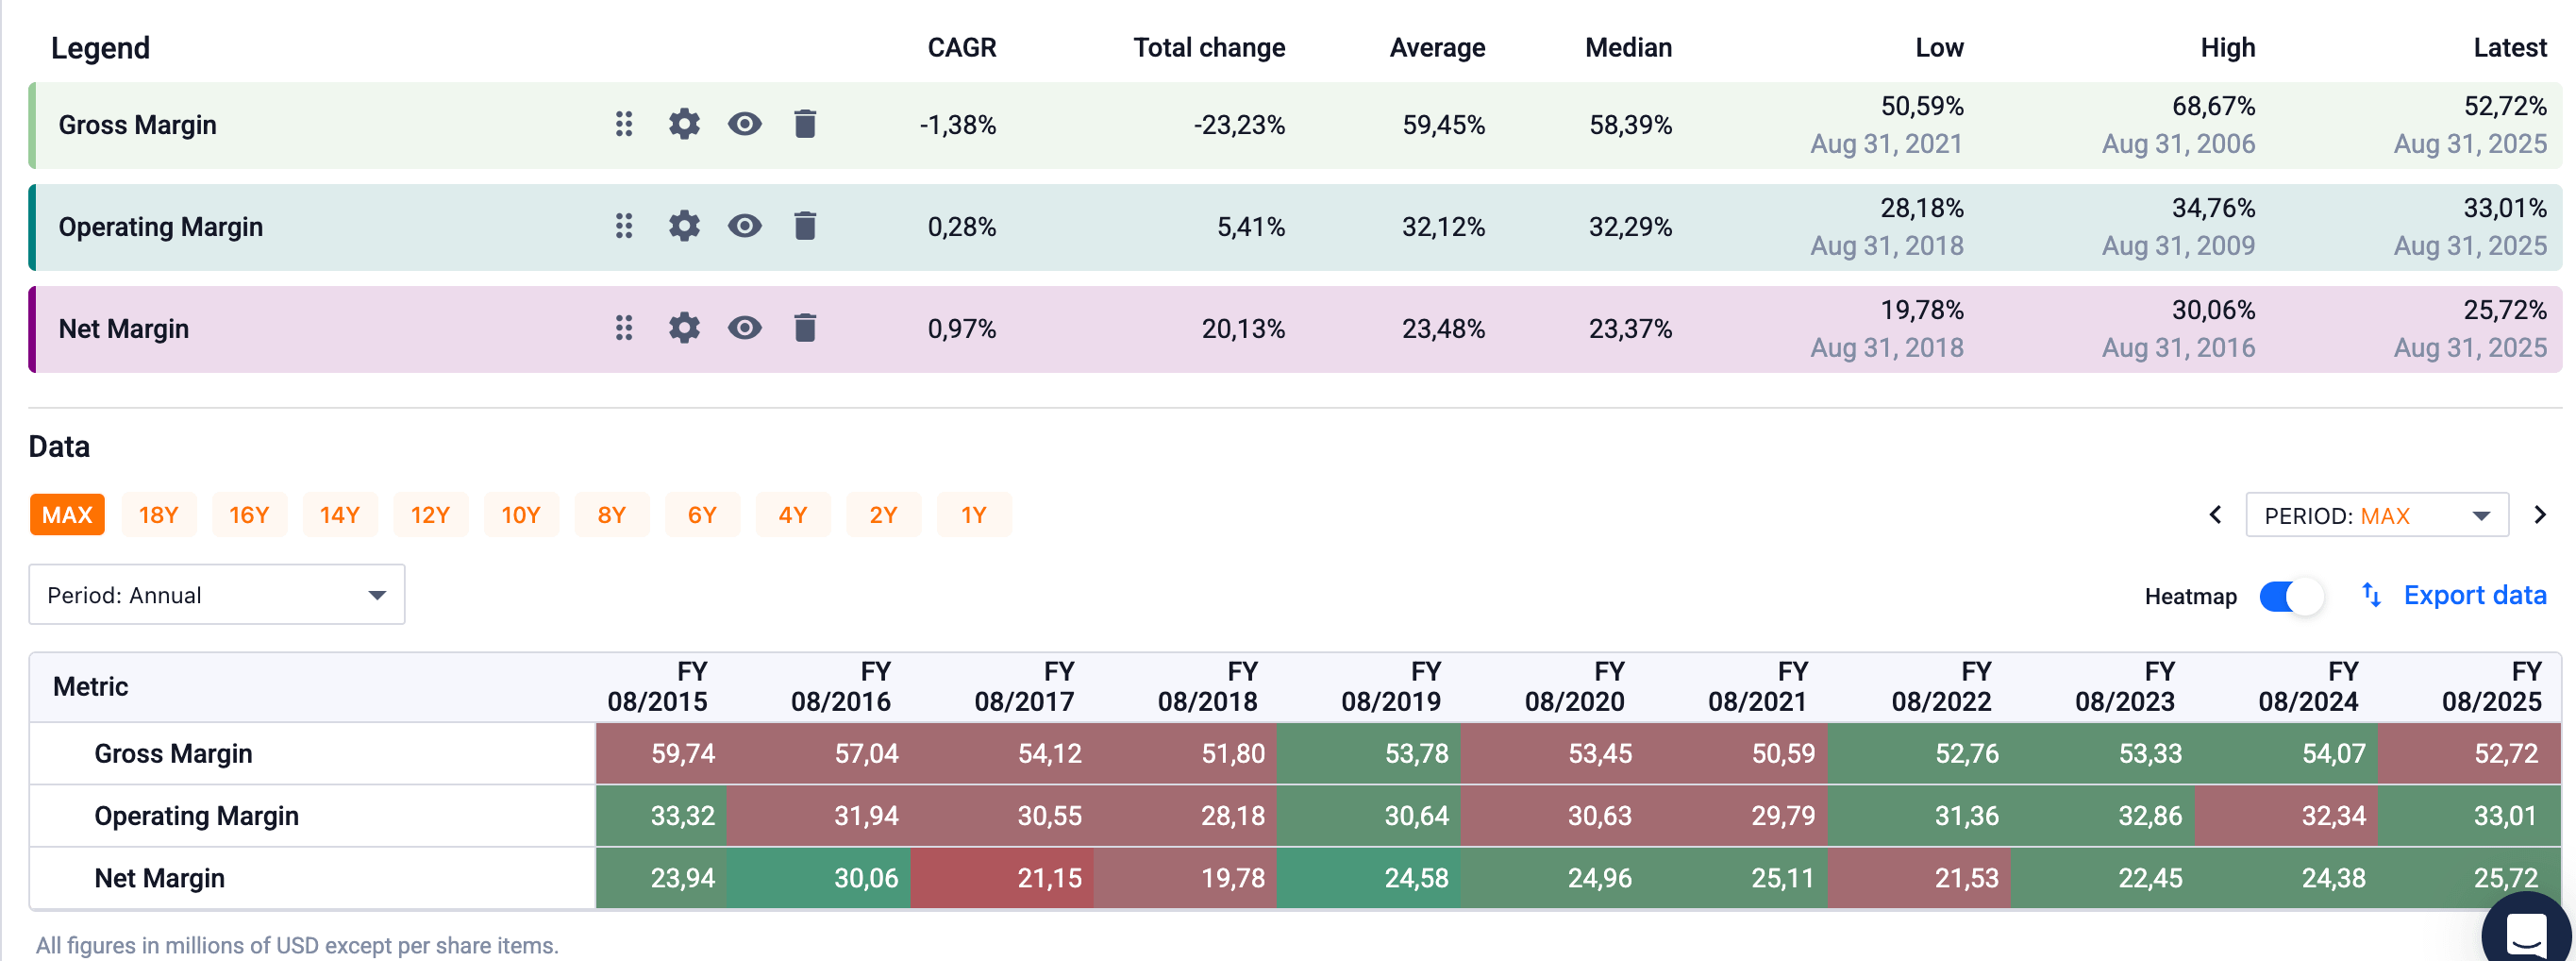
Margins: The Investment vs. Profitability Debate
This is where things get complicated.
The GAAP operating margin for Q2 FY2026 was 30.3%, down 220 bps from Q2 FY2025 (32.5%). The adjusted operating margin was 35.0%, down 230 bps (vs. 37.3%).
The causes of margin compression are clearly identified:
Higher compensation: annual merits, new CEO costs, India Labor Codes Reform, higher bonuses.
Increased technology spending: cloud infrastructure, AI tools.
Higher intangible amortization: due to growing capitalization of internal software development.
Management was transparent about this during the conference call.
Helen Shan explains: “In line with our plan, this reflects the timing of strategic investments driven by three main factors. First, higher people expense. Second, accelerated technology spend on cloud infrastructure and AI tools. Third, higher professional fees.”
The CEO outlines the investment framework: approximately 250 bps of gross investment, of which ~2/3 goes toward growth (data expansion, deepening workflows) and ~1/3 toward structural improvements (infrastructure, cybersecurity). Offset by approximately 100 bps of productivity gains, for a net impact of ~150 bps on the FY2026 margin.
My analysis: The margin compression is intentional and explained, not suffered. That is a crucial point. Management is investing to accelerate growth and modernize the platform. The question is: will these investments generate sufficient ROIC?
The early signals are encouraging: the acceleration in ASV growth (from ~4% at the start of FY2025 to ~6.7% at Q2 FY2026) coincides with this investment phase. More than 50% of the targeted 100 bps productivity gains have already been captured in H1.
But beware: management maintains its adjusted margin guidance at 34.0%–35.5% for FY2026, while acknowledging that performance-based compensation could be higher if commercial momentum continues. There is a risk of additional compression in H2 if bonuses surge.
Margin Rating: ⭐⭐⭐
Intentional but real compression. Investments appear sound, but proof of ROIC won’t come until FY2027–2028. Must monitor the rebound.
Continue reading this post for free, courtesy of Pierre Winter.